Download
1 / 85
910 likes | 1.4k Views
Spectral Analysis. Aliasing. Sample Volume. Spectral Analysis. Breaks up the frequency components of a complex wave or signal and spreading them out in order of increasing frequency. Presents Doppler shift frequencies in frequency order. Spectral Analysis.

E N D
Spectral Analysis • Breaks up the frequency components of a complex wave or signal and spreading them out in order of increasing frequency. • Presents Doppler shift frequencies in frequency order
Spectral Analysis • Allows visualization of the quantitative data in the Doppler signal in the form of a Doppler frequency spectrum so that Doppler shift can be evaluated • The Doppler shift voltage from the detector does not go directly to the display, but undergoes further processing
Spectral Analysis • Vertical axis represents frequency shift or velocity; the horizontal axis represents time • Allows measurements of peak, mean, and minimum flow velocities to be made • Permits evaluation of Doppler waveform characteristics such as flow direction and frequency range present (spectral broadening)
Components of the Spectrum • Spectral broadening • Window
Spectral broadening - vertical thickening of the spectral trace • The spectral trace would be a thin line if all the cells are moving at the same speed
Spectral broadening • With disturbed or turbulent flow, a greater variation in velocities of various portions of the flowing blood produces a greater range of Doppler shift frequencies - resulting in a broadened spectrum. Note: Spectral broadening does not necessarily mean flow that is turbulent or disturbed, but may be the result of abnormal vessel geometry like a tortuous vessel
Spectral broadening • Indicative of disturbed or turbulent flow and can be related to pathology, such as stenosis, at the site of measurement or distal to it • Can be artificially produced by excessive Doppler receiver gain • Some broadening are produced by beam spreading, particularly with wide-aperture arrays
Window • refers to the dark anechoic area in the lower portion of the spectral trace in systole for normal flow. • The window is diminished or eliminated with spectral broadening
Flows properties that influence the Spectrum • Narrow spectrum is expected near the center of the vessel, where the cells are moving the fastest • Narrow spectra often seen in large vessels • Broad spectrum is expected near the walls, where viscous drag is slowing the flow • Broad spectra seen in small vessels • Intermediate spectra in medium-sized vessels
Flows properties that influence the Spectrum • Different flow conditions produce various spectral presentations. • Vessel size, turns, & abnormalities, (plaque or stenosis) can alter the flow characteristics. As the ultrasound beam intersects this flow & echoes are produced, many different Doppler shifts are received from the vessel, even from a small sample volume, and is referred to as the Doppler frequency spectrum.
Flows properties that influence the Spectrum • Various kinds of blood flow (plug, laminar, parabolic, disturbed, and turbulent) produce varying ranges of Doppler shift frequencies in vessels • Impedance conditions downstream (distally) give rise to very different spectral displays. Flow reversal in early diastole and lack of flow in late diastole indicate high resistance to flow downstream (i.e. - due to vasoconstriction of arterioles)
Distal Impedance • Changing the angle does not change the relationship between peak systolic and end-diastolic flows, changing the distal resistance does • Pulsatility indexes are quantitative indicators of distal impedance
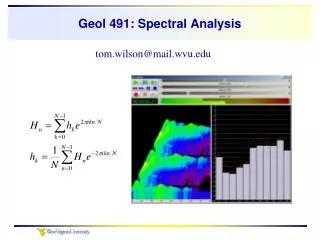
Fast Fourier Transform (FFT • Technique that processes the Doppler shift frequency information into the visual Doppler spectrum (this process is also referred to as Signal or Spectral Analysis) FFT uses a complex mathematical technique
Fast Fourier Transform (FFT) Math involved is accomplished by the pc • Returning echoes generated by each individual red blood cell have many different frequencies comprising the Doppler signal • FFT breaks down the complex Doppler signals into a format displaying each individual frequency
Fast Fourier Transform • Doppler shift frequency is the vertical axis • Power (amplitude) of each frequency component, demonstrated by the brightness of the signal, is determined by the number of RBCs moving at a certain velocity & time • Horizontal axis represents time
Pulsatility & Impedance • The Doppler waveform defines a flow property called pulsatility & has low, moderate, or high features • Pulsatility index (PI) works because flow impedance is not constant over the cardiac cycle with distensible vessels and pulsatile pressures. Recall that impedance includes flow resistance, inertia of blood, and compliance of vessel walls
Pulsatility & Impedance • Impedance is greater at lower pressures & smaller at higher pressures • Careful use of the wall filter must be exercised because it can affect the pulsatility index
Low pulsatility waveforms have broad systolic peaks & forward flow throughout diastole
High pulsatility waveforms have tall, narrow, sharp systolic peaks & reversed or absent diastolic
Velocities • Peak velocity is the maximum velocity at any given time • Mean velocity is the average of available signals • Minimum velocity refers to the lowest diastolic velocity
Velocity Ratios 2 commonly used measurements derived from these velocities are: • pulsatility index (PI) • resistivity index (RI)
Pulsatility Index = (maximum velocity - minimum velocity) mean velocity
Resistivity Index (Resistivity Index of Pourcelot) = (maximum velocity- minimum velocity) maximum velocity
Time Domain Correlation • another technique that processes the Doppler shift frequency data into visual Doppler spectrum • Recently developed • Determines the velocity of a moving reflector by measuring the change in spatial location during a known time interval • Unique features include the ability to identify a particular echo signal waveform in multiple echo wavetrains consisting of many echoes & track the individual echo signals in time
Autocorrelation techniques • Used to rapidly obtain Doppler shift frequencies used in color flow Doppler • Faster process than Fast Fourier Transform technique • Less accurate than spectral Doppler because it represents the mean Doppler shift • Compares measurements acquired from the same reflector
Autocorrelation techniques • Autocorrelation detector does not depict spectral analysis of the Doppler signal from each sample volume • Based on pulsed sampling technique & is subject to aliasing
(Mis)interpretation of spectral trace information • Largest Doppler shift does not necessarily represent the fastest blood flow- undisturbed laminar flow is necessary for the largest spectral Doppler shift to correspond to the largest flow speed
(Mis)interpretation of spectral trace information • Highest Doppler shifts correspond to the fastest flow & the lowest to the slowest • Is true only for undisturbed & non-turbulent flow in which all portions of fluid are moving parallel to each other with a common Doppler angle • If flow is disturbed, turbulent, or helical, or the vessel is tortuous, this assumption is not valid
(Mis)interpretation of spectral trace information • Peak Doppler shifts may not represent the fastest flow but, possibly, slower flow that is moving directly toward or away from the transducer (small Doppler angle, high Doppler shift)
(Mis)interpretation of spectral trace information • Lowest Doppler shifts do not necessarily represent the slowest flow but, possibly, faster flow that is moving nearly perpendicular to the beam (large Doppler angle, low Doppler shift)
(Mis)interpretation of spectral trace information • Spectral traces that have vertical axes calibrated in speed units (m/s or cm/s) are correctly calibrated presentations only if the Doppler angle incorporation is proper & straight, parallel, laminar, undisturbed flow is being measured
(Mis)interpretation of spectral trace information • Doppler instruments detect a Doppler shift that is proportional to speed of flow along the sound beam direction • If flow is not straight, large Doppler shifts do not necessarily correspond to the fastest flow & small ones do not necessarily correspond to the slowest flow
Basic Principles of Color Flow Imaging • Color-Doppler instruments present anatomic information in: • Conventional gray-scale form • Echoes returning from stationary tissues are detected & presented in gray scale in appropriate locations along scan lines • Doppler-shift frequencies at locations along each scan line, are presented as color at locations in the image Color flow mapping (CFM) or color flow imaging (CFI)
Depending on whether the motion is toward or away from the transducer, the Doppler shift is either positive or negative. At locations along scan lines where Doppler shifts are detected, appropriate colors are assigned to the display
Color Acquisition Color information is obtained by positioning many pulsed Doppler lines & gates over the area of interest called a packet • Packets are composed of between 3-30 pulses per line of color
Large packet size require/provide: • More accurate velocity measurement & color sensitivity • More time required to collect data • More pulses to make single frame • Lower frame rate: ⇩ temporal resolution
Doppler Shift Calculations • Mean frequency is calculated by autocorrelation technique and assigned a color depending on flow direction & velocity • Color-Doppler instruments require multiple pulses per scan line (same idea as a multiple focus scan line) for the autocorrelation process
Instruments Color-Doppler instrument has the same block diagram as the gray-scale sonographic instrument. The beam former, signal processor, image processor, and display perform the same functions as they do in the sonographic instrument. The major differences are that the signal processor must include the ability to detect Doppler shifts and the display must be capable of presenting echoes in color
Color maps - are used to aid the examiner interpreting the study in determining flow direction Two different modes of maps • Velocity mode • Variance mode
Velocity mode • all measured velocities for each gate are averaged then the colors are ranged up & down
Variance mode • A measure of the spread around the mean • an indicator of the extent of turbulence or flow disturbance • average velocity is calculated then the colors are side-to-side (used primarily in cardiac imaging to show turbulence) • shown as a change in hue from left to right across the map
Components of Color Various combinations of: • Hue • Saturation • Luminance are used to indicate the sign, mean magnitude & power (variance) of the Doppler shifts found at each location
Hue • perceived color; one or any combination of primary colors, red, yellow, green, blue, that is detected by the human eye Faster velocities are represented by lighter colors or hues
Saturation • degree to which the original color is diluted with white • Red mixed with white, becomes pink • The paler the pink the color is (more white), the less saturated it is • The purer the color is (less white), the greater the saturation Less color saturation represents faster flow