Download
1 / 25
250 likes | 368 Views
Adequate Yearly Progress (AYP) and Accountability Status Determinations. Massachusetts Department of Elementary and Secondary Education September 17 & 18, 2009. Topics. Review and Reporting Schedule AYP Basics Composite Performance Index (CPI) Four Factors that Determine AYP

E N D
Adequate Yearly Progress (AYP) and Accountability Status Determinations Massachusetts Department of Elementary and Secondary Education September 17 & 18, 2009
Topics • Review and Reporting Schedule • AYP Basics • Composite Performance Index (CPI) • Four Factors that Determine AYP • AYP Report Overview • Accountability Status and Required Actions • Contact Information
Review and Reporting Schedule • Monday, 8/17: Preliminary 2009 district and school AYP data provided electronically to superintendents and principals via the “Preview of 2009 AYP Data” application on the Security Portal: www4.doemass.org/auth/Login/ • Wednesday, 8/19: Notice sent to superintendents and principals whose district and schools are expected to be identified for improvement, corrective action, or restructuring based on preliminary 2009 AYP data • Friday, 8/21: Deadline to report AYP discrepancies via the Security Portal • Tuesday, 9/15: Official embargoed district and school AYP reports provided electronically for district review on the Security Portal • Wednesday, 9/16: Official AYP reports and lists of schools and districts in improvement status released to the public • Friday, 9/18: “Drive-In” AYP Information Session at Marlborough H.S.
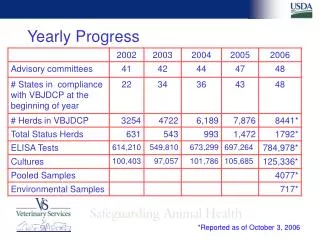
Adequate Yearly Progress – Facts • AYP reports show progress toward having all students reach grade level proficiency by the year 2014 – the principal goal of NCLB • AYP determinations are issued separately for ELA and Math • For each subject there are multiple AYP determinations - for all students (the aggregate) and for student groups. Students are counted in each group to which they belong. • District AYP determinations are based on grade-span results (3-5; 6-8; 9-12). Positive results for all groups in any grade-span yields a positive AYP determination. • Schools and districts that do not make AYP for two or more consecutive years in the same subject are identified for improvement, corrective action, or restructuring to focus efforts on improving student performance. • Schools and districts with an accountability status that make AYP for a single year remain at the previous year’s status.
Composite Performance Index (CPI) • The CPI is: • a metric we use to measure school and district performance and improvement; • a 100-point index that combines the scores of students who participate in standard MCAS ELA and mathematics tests, and those who participate in the MCAS-Alt.
Composite Performance Index (CPI) Multiply the number of points by the number of students at each performance level, then divide the total number of points by the total number of students (example below)
Four Factors Determine AYP A + (B or C) + D = Affirmative AYP Determination
PARTICIPATION: Did at least 95% of students participate in MCAS in 2009? A A + (B or C) + D = Affirmative AYP Determination • Students are counted in each group to which they belong. • Calculated by taking all students enrolled in the school or district during the testing window divided by the number of students taking MCAS tests. • The “testing window” is defined as any student reported in SIMS as enrolled in the school in both the March and June SIMS submissions. • District participation calculations include students enrolled in outplacements at district expense.
PERFORMANCE: Did the student group perform at or above the 2009 performance target? (ELA = 90.2, Math = 84.3) B A + (B or C) + D = Affirmative AYP Determination • Performance targets established between 2001 and 2014, as required by NCLB • Targets set separately for ELA and for mathematics • Performance expectations increase every 2 years • Performance is measured using CPI • AYP determinations based on one year of data each year
PERFORMANCE: Did the student group perform at or above the 2009 performance target? (ELA = 90.2, Math = 84.3) B 100 95.1 100 90.2 90 92.2 85.4 80.5 84.3 80 ELA 75.6 Composite Performance Index (CPI) 70.7 76.5 70 68.7 60 60.8 Math 53.0 50 2001 & 02 2003 & 04 2005 & 06 2007 & 08 2009 & 10 2011 & 12 2013 & 14 A + (B or C) + D = Affirmative AYP Determination
PERFORMANCE: Did the student group perform at or above the 2009 performance target? (ELA = 90.2, Math = 84.3) B A + (B or C) + D = Affirmative AYP Determination • 20 in the aggregate • 40 for student groups (and at least 5% of total; groups of 200+ always included) Minimum “N” Size Rules:
IMPROVEMENT: Did the student group meet its own 2009 improvement target? C A + (B or C) + D = Affirmative AYP Determination
IMPROVEMENT: Did the student group meet its own 2009 improvement target? C 100 95.1 90.2 90 ELA Example 85.4 77.2 (2009) 80.5 80 75.6 Did this group meet its 2009 performance target? Composite Performance Index (CPI) 70.7 70.0 (2008) 70 2009 ELA state perf. target = 90.2 2009 CPI for group = 77.2 No, because 77.2 < 90.2 60 50 2001 & 02 2003 & 04 2005 & 06 2007 & 08 2009 & 10 2011 & 12 2013 & 14 A + (B or C) + D = Affirmative AYP Determination 100
IMPROVEMENT: Did the student group meet its own 2009 improvement target? C 100 100 95.1 90.2 90 ELA Example 85.4 77.2 (2009) 80.5 80 75.6 Did this group meet its 2009 improvement target? Composite Performance Index (CPI) 70.7 70.0 (2008) 70 (100-2008 CPI) ÷ 6 Years 100 – 70 = 30 points remaining 30 ÷ 6 = 5 points per year 70 + 5 = 75 (imp. target for 2009) Yes, because 77.2 > 75 60 50 2001 & 02 2003 & 04 2005 & 06 2007 & 08 2009 & 10 2011 & 12 2013 & 14 A + (B or C) + D = Affirmative AYP Determination
IMPROVEMENT: Did the student group meet its own 2009 improvement target? C A + (B or C) + D = Affirmative AYP Determination • The improvement target is expressed as a range • An “error band” surrounds the target number • Error bands range from 2.5 to 4.5, depending on size of group; 2.5 is typical
ADDITIONAL INDICATOR: Did the student group meet the target for the Additional Indicator (Attendance, Graduation)? D A + (B or C) + D = Affirmative AYP Determination Student groups in schools and districts serving grades 1-8 must: • Have an attendance rate of 92% or higher, or • Improve by at least 1 percentage point from the previous year
ADDITIONAL INDICATOR: Did the student group meet the target for the Additional Indicator (Attendance, Graduation)? D A + (B or C) + D = Affirmative AYP Determination Student groups in schools and districts serving grades 9-12 must have: • a four-year graduation rate of 65 percent applied to the 2008 graduation cohort, or • a two percentage point increase in the four-year graduation rate from the 2007 cohort to 2008 cohort, or • a five-year graduation rate of 70 percent applied to the 2007 graduation cohort.
2009 AYP Data – School Summary Title I Status, Choice / SES Summary / Detailed Data Links AYP History
2009 AYP Data – District Summary Summary / Detailed Data Links Grade span AYP Determinations AYP History
NCLB Accountability Status and Required Actions (School Level) * School Choice & SES apply to Title I schools only.
NCLB Accountability Status and Required Actions (District Level)
2009 NCLB Accountability Highlights • 937 schools (54%) in improvement status in 2009 • Up from 840 (50%) in 2008 • 109 districts (28%) in improvement status • Including 29 charters, 8 voc/techs, and 17 other single-school districts • Up from 89 in 2008 (including 26 charters, 6 voc/techs, and 11 other single-school districts) • 21 schools recognized for exiting accountability status
Resources Contact Us: ayp@doe.mass.edu / 781-338-3550 School and District Accountability and Assistance News : www.doe.mass.edu/sda/ 2009 AYP Materials: www.doe.mass.edu/sda/ayp/2009/default.html • 2009 MCAS and AYP Data Review and Release Schedule • School Leader’s Guide to the 2009 Adequate Yearly Progress Reports • 2009-10 School and District NCLB Accountability Status and Required Actions • 2009 Glossary of AYP Reporting Terms • Sample Parent/Guardian Notifications (NCLB Accountability Status/NCLB School Choice, Supplemental Educational Services (SES) , and Right-To-Know) • Federal Non-Regulatory Guidance on District and School Improvement • Giving Parents Options: Strategies for Informing Parents and Implementing Public School Choice and Supplemental Educational Services Under No Child Left Behind • Student Performance Goal Spreadsheet