Download
1 / 46
460 likes | 585 Views
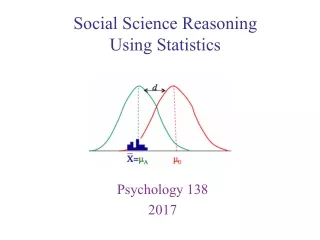
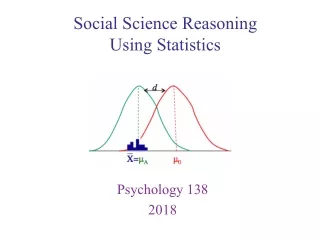
Statistics in Science. Data can be collected about a population (surveys) Data can be collected about a process (experimentation). STATISTICS!!!. The science of data. 2 types of Data. Qualitative Quantitative. Qualitative Data.

E N D
Statistics in Science Data can be collected about a population (surveys) Data can be collected about a process (experimentation)
STATISTICS!!! The science of data
2 types of Data Qualitative Quantitative
Qualitative Data Information that relates to characteristics ordescription (observable qualities) Information is often grouped by a descriptive category Examples Species of plant Type of insect Shades of color Rank of flavor in taste testing Remember: qualitative data can be “scored” and evaluated numerically
Qualitative data, manipulated numerically Survey results, teens and need for environmental action
Quantitative data Quantitative – measured using a naturally occurring numerical scale Examples Chemical concentration Temperature Length Weight…etc.
Quantitation Measurements are often displayed graphically
Quantitation = Measurement In data collection for Biology, data must be measured carefully, using laboratory equipment (ex. Timers, metersticks, pH meters, balances , pipettes, etc) The limits of the equipment used add some uncertainty to the data collected. All equipment has a certain magnitude of uncertainty. For example, is a ruler that is mass-produced a good measure of 1 cm? 1mm? 0.1mm? For quantitative testing, you must indicate the level of uncertainty of the tool that you are using for measurement!!
How to determine uncertainty? Usually the instrument manufacturer will indicate this – read what is provided by the manufacturer. Be sure that the number of significant digits in the data table/graph reflects the precision of the instrument used (for ex. If the manufacturer states that the accuracy of a balance is to 0.1g – and your average mass is 2.06g, be sure to round the average to 2.1g) Your data must be consistent with your measurement tool regarding significant figures.
Any lab you design for AP/IB Biology must have both quantitative and qualitative data
Quick Review – 3 measures of “Central Tendency” Quantitative data mean: sum of data points divided by the number of points Quantitative or qualitative data mode: value that appears most frequently median: When all data are listed from least to greatest, the value at which half of the observations are greater, and half are lesser.
Comparing Means Once the means are calculated for each set of data, the average values can be plotted together on a graph, to visualize the relationship between each set of data.
The Average Rate of Growth On Various Types of Trees 16 12 Growth in meters 8 4 0 beech maple hickory oak Type of Trees Measured
Error Bars Are a graphical representation of the variability of data.
Drawing error bars The simplest way to draw an error bar is to use the mean as the central point, and to use the distance of the measurement that is furthest from the average as the endpoints of the data bar
Value farthest from average Calculated distance Average value
The Average Rate of Growth On Various Types of Trees 16 12 Growth in meters 8 4 0 beech maple hickory oak Type of Trees Measured
What do error bars suggest? If the bars show extensive overlap, it is likely that there is not a significant difference between those values
Simply measure the lengths of each and plot how many are of each length
This Shape? Is a classic bell-shaped curve, AKA Gaussian Distribution Curve, AKA a Normal Distribution curve. Essentially it means that in all studies with an adequate number of data points (>30) a significant number of results tend to be near the mean. Fewer results are found farther from the mean
The standard deviation is a statistic that tells you how tightly all the various examples are clustered around the mean in a set of data
Standard deviation The STANDARD DEVIATION is a more sophisticated indicator of the precision of a set of a given number of measurements The standard deviation is like an average deviation of measurement values from the mean. The standard deviation can be used to draw error bars, instead of the maximum deviation.
According to this curve: One standard deviation away from the mean in either direction on the horizontal axis (the red area on the preceding graph) accounts for somewhere around 68 percent of the data in this group. Two standard deviations away from the mean (the red and green areas) account for roughly 95 percent of the data.
Three Standard Deviations? three standard deviations (the red, green and blue areas) account for about 99 percent of the data -3sd-2sd+/-1sd2sd+3sd
How is Standard Deviation calculated? With this formula!
AGHHH! DO I NEED TO KNOW THIS FOR THE TEST?????
Not the formula! This can be calculated on a scientific calculator OR…. In Microsoft Excel, type the following code into the cell where you want the Standard Deviation result, using the "unbiased," or "n-1" method: =STDEV(A1:A30) (substitute the cell name of the first value in your dataset for A1, and the cell name of the last value for A30.)
You DO need to know the concept! Standard deviation is a statistic that tells how tightly all the various data points are clustered around the mean in a set of data. When the data points are tightly bunched together and the bell-shaped curve is steep, the standard deviation is small.(precise results, smaller sd) When the data points are spread apart and the bell curve is relatively flat, a large standard deviation value suggests less precise results
Usefulness of SD Look at the data given for bean plants What is the mean for each sample? Both are 130 cm Now look at the variations of each sample. The plants in the shade are more variable than the ones in the sunlight. What does this suggest? Other factors may be influencing the growth in addition to sunlight and shade. SD allows you to mathematically quantify the variation observed. SD: 17.68 cm SD: 47.02 cm
The high SD of the bean plants in the shade indicates a very wide spread of data around the mean. • This should make you question the experimental design. • EX: The plants in the shade are growing in different soil types. • So…don’t just look at the means; they don’t offer the full picture
Try this question… 15mm The lengths of a sample of tiger canines were measured. 68% of the lengths fell within a range between 15 mm and 45 mm. The mean was 30 mm. What is the standard deviation of this sample?
The t-test • Used to determine whether or not the difference between 2 sets of data is a significant (real) difference. • Used to test the statistical significance between the means of two samples • When given the calculated value of t, you can use a table of t values (handout). • On the left hand column is “Degrees of Freedom”. • This is the sum of sample sizes of each group minus 2.
If the degrees of freedom is 9, & if the given value of t is 2.60, the table indicates that the t value is greater than 2.26. WHAT DOES THIS MEAN??? When you look at the bottom of the table, you will see that the probability that chance alone could produce the result is only 5% (0.05). This means that there is a 95% chance that the difference is significant.
SO… • Large t-values mean little overlap between two sets of data; difference between them • Small t-values mean much overlap and probably no difference • Calculated t<critical t value = differences between data are not significant = null hypothesis not rejected • Calculated t>critical t value = differences are significant = null hypothesis rejected.
Compare 2 groups of barnacles living on a rocky shore. The degree of freedom is 28. So the p =0.05, which means the probability that chance alone could produce this result is 5%. The confidence level is 95%. So, barnacles living nearer the water have a significantly larger shell than those living 10meters or more away from the water. • You are measuring the width of their shells to see if a significant size difference is found depending on how close they live to the water. • One group lives 0-10 meters from water • The other group lives 10-20 meters. • 15 shells from each group were measured. • The mean of the group closer to the water indicated that living closer to the water causes the barnacles to have a larger shell. • If the value of t is 2.25, is that a significant difference?
EX: Africanized Honey Bees (AHBs) This is an example of a mathematical correlation & is not evidence of a cause. These bees have migrated to the southwestern states of the US. They have not migrated to the southeastern states. The edge of the areas where AHBs are found coincides with the point where there is an annual rainfall of 55inches. This seems to be a barrier to the migration of the bees.
Correlation and cause Observations without experimentation show correlation Experimentation is necessary to show cause
Using A Mathematical Correlation Test r value is the correlation • Value of r can vary: • r=1 means completely positive correlation • r=-1 means completely negative correlation • r=0 means no correlation
Say we were trying to determine, among cormorant birds, if there is a correlation between the sizes of males & females which breed together. • Data is collected and an r value of 0.88 is determined. • What does this mean? • It shows a positive correlation between the sizes of the 2 sexes. • In other words, large females mate with large males.
Remember Correlation is not Causation • How would cause be determined? By Experimentation!!