Download

1 / 26
260 likes | 381 Views
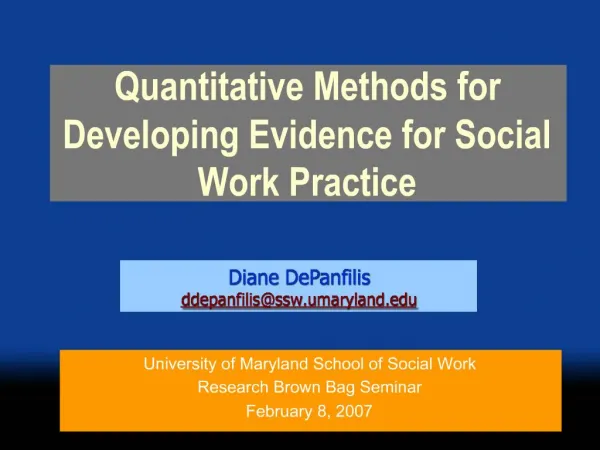
QUANTITATIVE EVIDENCE. Auckland, NZ April 5, 2005 Presented by: Colleen Cook Bruce Thompson. “22 Items and The Box ….”. Why the Box is so Important About 40% of participants provide open-ended comments, and these are linked to demographics and quantitative data.

E N D
QUANTITATIVE EVIDENCE Auckland, NZ April 5, 2005 Presented by: Colleen Cook Bruce Thompson
“22 Items and The Box….” Why the Box is so Important • About 40% of participants provide open-ended comments, and these are linked to demographics and quantitative data. • Users elaborate the details of their concerns. • Users feel the need to be constructive in their criticisms, and offer specific suggestions for action.
“…and Five Ancillary Items” Either Zero or Five Ancillary items are selected to address local or consortial concerns • Items from the initial LibQUAL+TM item pool. • Items written by previous consortial groups.
Library Service Quality Information Affect of Service Control Empathy Scope of Content Responsiveness Convenience Assurance Ease of Navigation Library as Place Reliability Timeliness Utilitarian space Equipment Symbol - Self Reliance Refuge Model 3 Some MeasurementIntegrity Evidence
alpha By Language By Language Service Info. Lib as Group n Affect Control Place TOTAL American (all) 59,318 .95 .91 .88 .96 British (all) 6,773 .93 .87 .81 .94 French (all) 172 .95 .90 .89 .95
alpha by University Type By University Type Service Info. Lib as Group n Affect Control Place TOTAL Comm Colleges 4,189 .96 .92 .89 .97 4 yr Not ARL 36,430 .95 .91 .88 .96 4 yr, ARL 14,080 .95 .90 .87 .96 Acad Health 3,263 .95 .92 .90 .96
Service Affect Service Affect (n = 71,170 English) SA20APER .80541 .22199 .27521 SA07APER .80338 .27236 .20993 SA17APER .79655 .20844 .22793 SA04APER .77062 .29258 .17694 SA15APER .73437 .34646 .24299 SA23APER .73391 .34359 .27896 SA01APER .71589 .29773 .16972 SA12APER .71541 .32229 .25528 SA10APER .68825 .35941 .28090
Library as Place Library as Place (n = 71,170 English) LP13APER .26213 .25710 .80013 LP05APER .20412 .15920 .73601 LP09APER .27765 .24869 .72631 LP24APER .26672 .34873 .72148 LP19APER .19630 .28102 .70295
Information Control Information Control (n = 71,170 English) IA18APER .29824 .73480 .28164 PC11APER .29045 .71111 .19999 IA03APER .24482 .70341 .18989 PC25APER .21770 .68760 .22736 PC21APER .41572 .65615 .30096 PC02APER .37847 .63860 .16559 PC16APER .33439 .61598 .36448 IA14APER .28759 .58521 .39295
Validity Correlations Validity Correlations Serv_Aff Info_Con LibPlace TOTALper Serv_Aff 1.0000 .7113 .5913 .9061 Info_Con .7113 1.0000 .6495 .9029 LibPlace .5913 .6495 1.0000 .8053 TOTALper .9061 .9029 .8053 1.0000 ESAT_TOT .7286 .6761 .5521 .7587 EOUT_TOT .5315 .6155 .4917 .6250
LibQUAL+™ 2004 SummaryColleges or UniversitiesAmerican English (n = 69,449)
LibQUAL+™ 2004 SummaryAcademic Law InstitutionsAmerican English (n = 4,092)
LibQUAL+™ 2004 SummaryAcademic Health SciencesAmerican English (n = 3,664)
LibQUAL+™ 2004 SummaryHospitalsAmerican English (n = 1,024)
LibQUAL+™ 2004 SummaryColleges or UniversitiesUndergraduates – American English (n = 37,661)
LibQUAL+™ 2004 SummaryColleges or UniversitiesGraduates – American English (n = 16,750)
LibQUAL+™ 2004 SummaryColleges or UniversitiesFaculty – American English (n = 11,755)
LibQUAL+™ 2004 SummaryColleges or UniversitiesStaff – American English (n = 3,283)
Score Norms • Norm Conversion Tables facilitate the interpretation of observed scores using norms created for a large and representative sample. • LibQUAL+™ norms have been created at both the individual and institutional level
Institutional Norms for PerceivedMeans on 25 Core Questions Note: Thompson, B. LibQUAL+ Spring 2002 Selected Norms, (2002).
In Closing • LibQUAL+™ methodology focuses on success from the users point of view (outcomes) • Demonstrates that a web-based survey can handle large numbers; users are willing to fill it out; and survey can be executed quickly with minimal expense • LibQUAL+™ requires limited local survey expertise and resources • Analysis available at local and inter-institutional levels • Many opportunities for using demographics to discern user behaviors
LibQUAL+™ Resources • LibQUAL+™ Website:http://www.libqual.org • Publications:http://www.libqual.org/publications • Events and Training: http://www.libqual.org/events • LibQUAL+™ Bibliography: http://www.coe.tamu.edu/~bthompson/servqbib • LibQUAL+™ Procedures Manual:http://www.libqual.org/Information/Manual/index.cfm