Download
1 / 40
420 likes | 609 Views
Using fMRI to Evaluate Working Memory Function of FASD. Krisztina Malisza, PhD Institute for Biodiagnostics National Research Council of Canada. What are we trying to do?. Neural Activity In Response to task. Where Detection. How Much Quantify. What do we measure with fMRI?.

E N D
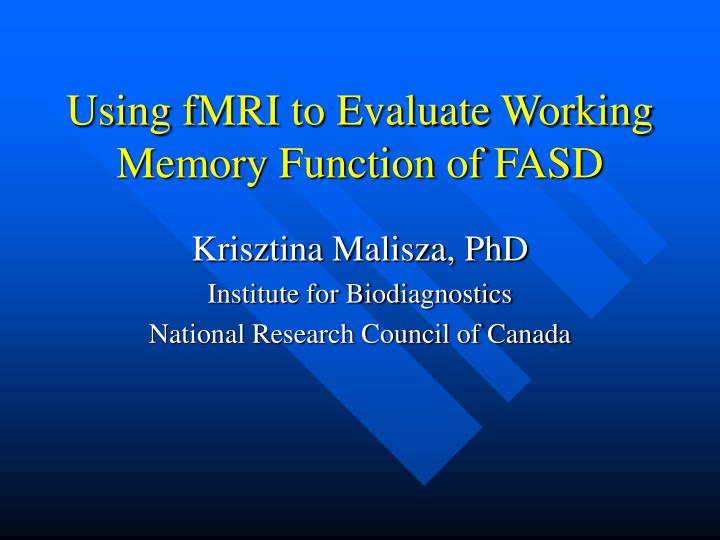
Using fMRI to Evaluate Working Memory Function of FASD Krisztina Malisza, PhD Institute for Biodiagnostics National Research Council of Canada
What are we trying to do? Neural Activity In Response to task Where Detection How Much Quantify
What do we measure with fMRI? Metabolism O2 Brain Activity Blood Flow O2
What do we measure with fMRI? Metabolism O2 dHb Deoxyhemoglobin causes a variation in the local magnetic field on a macroscale Brain Activity Blood Flow O2 dHb
What do we measure with fMRI? Metabolism O2 dHb T2* Brain Activity Blood Flow O2 dHb T2* • T2* - transverse relaxation caused by variations in local field on a macroscale
What do we measure with fMRI? Metabolism O2 dHb T2* MR Signal Brain Activity Blood Flow O2 dHb T2* MR Signal
What do we measure with fMRI? Metabolism O2 dHb T2* MR Signal Brain Activity Blood Flow O2 dHb T2* MR Signal
fMRI Background • Physiological effects relating to changes in neuronal activity cause changes in the MR signal intensity By imaging a volume of the brain or spinal cord repeatedly during alternated “rest” and “task” periods, we can detect where the signal intensity changed in relation to the activity
Objectives: • To determine FASD child/adult brain function in areas of attention, spatial memory and working memory • Develop MRI based techniques to aid diagnosis of FASD • To determine if there are different regions of fMRI activity in subjects with FASD than controls using a working memory task
Methods • Subjects: • Child Control n=15 Child FASD n=14 • Adult Control n=10 Adult FASD n=10 • fMRI • 1.5T GE Signa LX MRI system • Gradient-Echo Echo Planar Imaging (EPI) • 3 activation states alternated with 4 rest states (NR=56)
N-BackTasks (n=0) Simple (2 1 4 3) (n=1) One-back (NR 2 1 4) (n=2) Two-back (NR NR 2 1)
N-BackTasks (n=1) Blank (NR 2 NR 4)
Methods • 4 fMRI tasks: • Saccadic eye movement • Finger movement • Working memory (spatial, object) • Procedural learning • Attention
HUMAN BRAIN: PREFRONTAL CORTEX A. Spatial working memory B. Spatial working memory, performance of self-ordered tasks C. Spatial, object and verbal working memory, self-ordered tasks, analytic reasoning D. Object working memory, analytic reasoning Scientific American, August 1997
Brain Regions • Prefrontal cortex (DLPFC) • working memory • Anterior cingulate • attention, response selection • Parietal lobe • discrimination, memory, spatial perception • Insula • Visceral function, integrates autonomic info • Connections to temporal & parietal lobe • Response inhibition/selection • Executive function
Data Analysis • 50% correct responses on fMRI tasks • Children (FASD: Control): • Blank: 9:14 • 1-Back: 7:13 • Adults (FASD: Control): • Blank: 10:10 • 1-Back: 6:9
Data Analysis • SPM 99 (computer program) • Images corrected for motion, normalised to a adult or child template then smoothed • Individual activations in more difficult tasks (n=1) subtracted from simple (n=0) task • Activations displayed on a T1 template
Combined adult and child fMRI task performance Open bars: Controls; Filled bars: FAS participants
FASD (25y,F) FASD (26y,F) Adults P=0.01 P=0.01 P=0.05 Control (26y, F) P=0.01 P=0.05 Blank - simple
Adults FASD, 26y and 25y, F P=0.01 P=0.05 Control, 26y, F P=0.01 P=0.05 1-back - simple
Mean Response Times 0.7 Adult Control *** Adult FAS *** 0.6 *** 0.5 *** 0.4 Latency (s) 0.3 0.2 0.1 0 Simple 1-back blank 2-back Task
Incorrect and No responses 10 Adult Control 9 Adult FAS 8 7 6 Average Number of Incorrect and No Responses 5 4 3 ** 2 * 1 0 simple 1-back blank 2-back Task
S51 – FASD (11y, F) S45 – FASD (11y (just), F) Children P=0.01 P=0.01 P=0.01 P=0.01 S32 Control (11 y, F) S47 Control (10 y, F) Blank - simple
Children S51 – FASD (11y, F) S45 – FASD (11y (just), F) P=0.01 P=0.01 P=0.01 P=0.01 S32 Control (11 y, F) S47 Control (10 y, F) 1-back - simple
Response times Child control 0.7 Child FAS 0.6 *** ** 0.5 0.4 Latency (s) 0.3 0.2 0.1 0 simple 1-back blank 2-back Tasks
Incorrect and No responses Child Control ** 14 Child FAS 12 * 10 ** 8 Average Number of Incorrect and No Responses 6 * 4 2 0 simple 1-back blank 2-back Task
fMRI Conclusions • Adults & Children • Consistent activations in brain regions associated with working memory (DLPFC) and attention (cingulate) • Controls - increase in frontal activity with increasing task difficulty; not as consistent in FASD • FASD – greater inferior frontal activation than controls • Controls – activation in insula; very little if any in FASD • promising preliminary results - full study required
Self-Ordered Pointing • Test of visual working memory and strategic memory • Presented with n sets of n pictures (n = 6, 8, 10 or 12) • In each sheet of a given set, S must touch a different picture
Wisconsin Card Sorting Task • Successful performance requires • Planning ability • Cognitive flexibility • Working memory • Response inhibition • Concept formation and reasoning Kolb & Whishaw, 2001, p.541
Continuous Performance Task • Detect the presence of targets in a series of trials that include distractors • Measures: • # correct responses • correct response latency • probability of a hit • probability of a false alarm
* Group, F(1,14) = 10.14, p<.01
CPT • Age main effect: Children performed worse than adults on all 4 indicies • Group main effect: FAS performed similarly to controls on all measures except mean latencies of correct responses • significantly longer than controls p <0.01 • Indicates that group differences on other measures were unlikely due to group differences in ability to remain on task.
Conclusions • Adults and children with FASD show impaired performance relative to age- and sex-matched controls, on tasks tapping into executive function, sustained attention, and visual working memory • Significant latency of response for FASD subjects compared to controls – but both groups paying attention!! • Not all exposed individuals show deficits • Studying unique neuroanatomical & neuropsychological profile of individuals with FASD is important for design of assessment tools, and development of support and intervention programs for patients and their families • fMRI may prove helpful in this regard
Acknowledgements IBD - Ms A. Allman, Dr. D. Shiloff U of M, Psychology – Dr. L. Jakobson HSC – Dr. A. Chudley, Dr. S. Longstaffe child life specialists Ms D. Kuypers Ms S. Treichel Financial support Manitoba Medical Services Foundation Ava-Ann Allman- Women in Engineering and Science (WES) Award -NRC


![Attention, Working Memory, and Executive Function [Processes Under Construction]](https://cdn2.slideserve.com/4587086/slide1-dt.jpg)