Download
1 / 23
230 likes | 425 Views
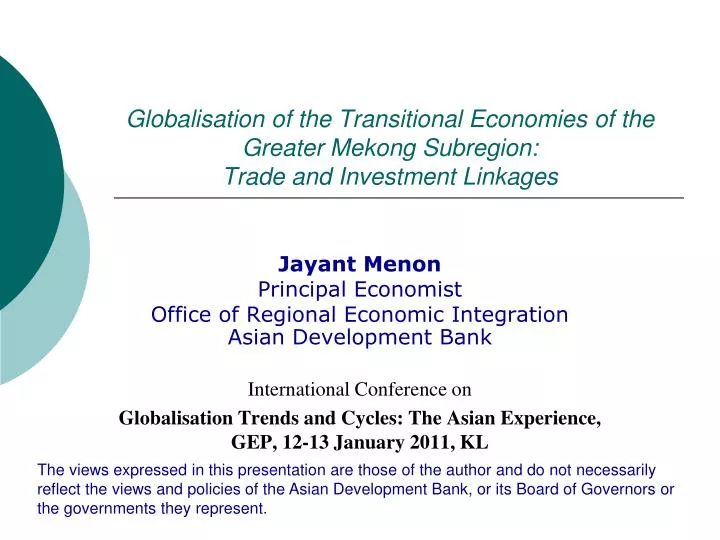
Globalisation of the Transitional Economies of the Greater Mekong Subregion: Trade and Investment Linkages. Jayant Menon Principal Economist Office of Regional Economic Integration Asian Development Bank International Conference on

E N D
Globalisation of the Transitional Economies of the Greater Mekong Subregion: Trade and Investment Linkages Jayant Menon Principal Economist Office of Regional Economic Integration Asian Development Bank International Conference on Globalisation Trends and Cycles: The Asian Experience, GEP, 12-13 January 2011, KL The views expressed in this presentation are those of the author and do not necessarily reflect the views and policies of the Asian Development Bank, or its Board of Governors or the governments they represent.
Presentation Outline • Socioeconomic Progress in the Greater Mekong Subregion: 1990-2009 • Changing patterns of trade and investment in GMS • Remaining Issues and Challenges - Unfinished Policy Agenda - Reducing vulnerability to shocks
Progress in the GMS • The GMS enjoyed sustained economic growth in the lead up to the Global Financial Crisis in 2008/09. • In real terms, the GMS has grown at a faster pace than the whole of East Asia and the Pacific, with much of this growth coming from the CLMV countries. • This growth has been accompanied by a gradual shift away from agriculture towards manufacturing and services, which now account for a bigger share of value added. • Economic progress has also translated into marked improvements in human development outcomes across the subregion.
Table 1. Economic Growth and Restructuring in the GMS Source: World Bank World Trade Indicators 2009/10 and World Development Indicators 2010
Table 2. Socio-economic and Poverty Indicators in the GMS, 1995-2008 /1 Cambodia data for 1993 Source: World Bank World Trade Indicators Online, 2009/10, World Bank Development Indicators 2010
Increased openness and economic cooperation have helped spur growth in GMS • Unilateral liberalization in CLMV economies • Cambodia in 1985 • Lao PDR and Viet Nam in 1986 • Membership in economic cooperation and trade agreements • ADB’s GMS Program • ASEAN, AFTA and WTO • Preferential trading agreements (PTAs)
Trade in the GMS: Overall Trends • Unilateral policy reforms and greater economic cooperation have led to positive trade growth in the GMS. • With the exception of Myanmar, trade openness has increased throughout the region, with trade as a percentage of GDP above 100% in Cambodia, Thailand and Viet Nam.
Figure 2. Increasing Trade and Trade Openness in GMS, 1990-2009 (in current US$) Sources: IMF Directions of Trade Statistics; IMF World Economic Outlook database
Direction of Trade • Except for Cambodia, the direction of trade over the past two decades suggests a marked expansion in GMS’ countries trade not only with the world, but more particularly among themselves. • Thailand and Viet Nam have shown modest increases in intra-GMS trade, and trade predominantly with the rest of the world, and have more diversified partners. • The share of intra-GMS trade in total trade has been higher for the smaller countries, Lao PDR and Myanmar.
Figure 3. Direction of Trade, 1990-2008 Source: IMF Direction of Trade Statistics
Composition of GMS Exports • Changing demand for export products has helped transform the structure of exports from the subregion. • In Cambodia, textiles and garments quotas from the US and EU led to the emergence of an extremely narrow export base dominated by clothing and footwear. • In Thailand, trade in machinery and other equipment comprised almost half of total exports in 2008 due to production fragmentation trade. • In Viet Nam, primary commodities still make up close to 40% of total exports, but there is a clear shift towards a more diversified export base. • In Lao PDR and Myanmar, there was a similar shift away from primary commodities in 2000. However, this trend has since been reversed due to increased external demand for primary commodities, particularly ores and metals in the case of Lao PDR, and natural gas in the case of Myanmar.
FDI in GMS: Overall Trends • In 2008, total FDI stock in GMS amounted to US$153 billion, or 37% of total GDP. Historically, Thailand has been the largest FDI recipient in the region, but Viet Nam has been catching up in the last couple of years. • Cambodia and Viet Nam have FDI stock to GDP ratios well above the GMS average, with Thailand just slightly below it. • The source country composition of FDI to GMS countries is characterized by a clear (Asian) regional bias. • As for intra-GMS FDI flows, data for 1995-2005 suggest that these have been important sources of capital for the smaller GMS countries, particularly Lao PDR, where they accounted for more than a third of total FDI flows, originating mostly from Thailand.
Figure 6. FDI and FDI Openness in GMS, 1990-2008 Source: UNCTAD World Investment Report 2010
Figure 7. FDI Inflows into GMS Countries by Source Country, 2000-2008 Source: ASEAN Statistical Yearbook 2008
Figure 8. Share of Intra-GMS Inflows in Total FDI, 1995-2005 Source: ASEAN (2006). Statistics of Foreign Direct Investment in ASEAN, Eighth Edition
Unfinished Policy Agenda and Reducing Vulnerability • Two general issues considered. Unfinished policy agenda: - trade policy reform Reducing vulnerability to shocks: - Diversification of exports and export markets - Rebalancing growth
Trade Policy Reform • Biggest challenge is dealing with trade facilitation and NTBs • Widely recognized, focus of attention, work ongoing • Should not neglect traditional area of tariff related liberalization since reforms incomplete • Furthermore, growth in FTAs present new challenges in rationalizing tariff structures
Multilateralizing AFTA Preferences • Original ASEAN members have been multilateralizing most of their CEPT tariff preferences. • When fully multilateralized, margin of preference (MoP) is zero, as is potential for trade diversion • In this way, AFTA a building block towards open and free trade
Multilateralizing AFTA Preferences • New ASEAN members have not. • MoPs in 2007 around 15% in Viet Nam, and 7-8% in Cambodia and Lao PDR • Running two-tier tariff (MFN and CEPT) system on most tariff lines • This will increase to at least 6 rates and then more when the ASEAN+1 and other individual bilateral FTAs kick-in; with as many deadlines and potentially as many RoOs!
Multilateralizing AFTA Preferences • Why? Trying to mitigate revenue loss? • Unlikely, given trade deflection opportunities and potential for increased rent seeking behavior • Furthermore, cost of administering two-tier system and implementing RoOs costly and burdensome, given institutional weaknesses and an overstretched customs bureaucracy
Reducing vulnerability to shocks Diversification of exports Intra-sectoral diversification more viable and less costly than inter-sectoral diversification Can be mostly accommodated by factor transfer within export-oriented industries Consider activities related to agro-processing eg. rice milling, before cars and planes!
Rebalancing Growth • GFC highlighted the need to rebalance growth from foreign to domestic sources • China should, and maybe Thailand, but what about other GMS? • Despite growing exports, net exports contribution to growth still small or negative • As capital importing countries, most run trade & current account deficits
Thank you! For inquiry or comments, please contact:Jayant Menon Principal Economist, OREITelephone: (63-2) 632-6205 Email: jmenon@adb.org