Download
1 / 24
240 likes | 407 Views
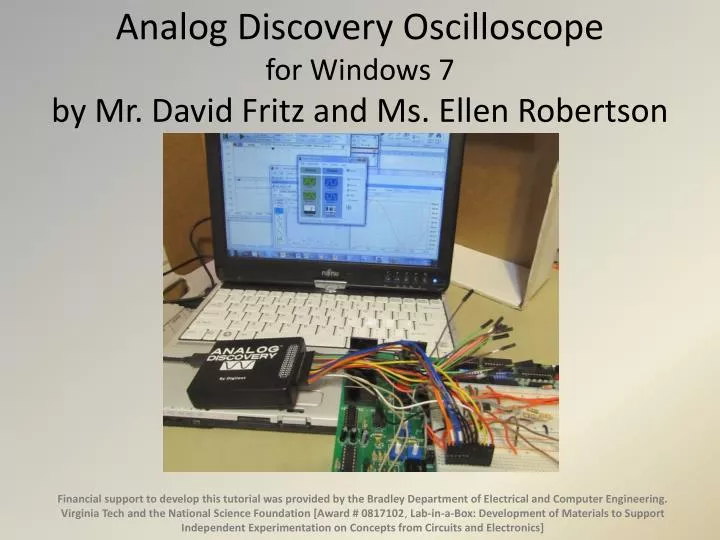
Analog Discovery Oscilloscope for Windows 7 by Mr. David Fritz and Ms. Ellen Robertson. Starting the oscilloscope. Install the scope software from the Digilent website Attach the scope to the USB port (Drivers install automatically)

E N D
Analog Discovery Oscilloscope for Windows 7 by Mr. David Fritz and Ms. Ellen Robertson Financial support to develop this tutorial was provided by the Bradley Department of Electrical and Computer Engineering. Virginia Tech and the National Science Foundation [Award # 0817102, Lab-in-a-Box: Development of Materials to Support Independent Experimentation on Concepts from Circuits and Electronics]
Starting the oscilloscope • Install the scope software from the Digilent website • Attach the scope to the USB port(Drivers install automatically) • Launch scope control softwareStart -> Programs -> Digilent -> WaveForms(You will probably want to make a shortcut) Note: When closing, the WaveForms software stores the last configuration (if set to do so). To make sure that you have the factory default settings (even if somebody previously saved a different WaveForms configuration on your machine), click “Options” in the WaveForms main window, then “Erase configuration” in the Options window. Close the Options window. D. Fritz and E. Robertson
What if the software doesn’t find the Analog Discovery? • You may see a pop-up that states that you are in Demo mode because the software did not find the scope. • ClickOKto use Demo mode. • Check to make sure that you plugged the Analog Discovery into one of your computer’s USB ports. • Next, click on Demo on the Device Manager window that pops up, then click Select. D. Fritz and E. Robertson D. Fritz and E. Robertson
To Launch the Oscilloscope Program • From the main window of Waveforms, you can launch the oscilloscope, also known as scope, by clicking on the button. Or, click on the arrow next to the button and then click on Open New in from the drop-down menu. D. Fritz and E. Robertson
Remember this: • Sin(x) varies from -1 to +1 V1(t) = B sin(xt) is a sinusoidal voltage that varies from –B to +B, the amplitude of the voltage is B, and the peak-to-peak voltage Vpp= 2B V2(t) = B sin(xt) + C is a sinusoidal voltage with a DC offset that varies from V2min = (–B+C) to V2max= (+B+C) and the peak-to-peak voltage Vpp = 2B. The AC amplitude of the voltage signal is still B. • You can measure the amplitude of a time-varying voltage signal using the DMMY64 using V~ , but you won’t get the same answer as measured using the oscilloscope. • The DMM displays the root-mean-squared value of the voltage (VRMS). However, it is not a true RMS value. The DMM assumes that all time-varying signals are sinusoids that has a frequency between 40Hz and 400Hz and there is no DC offset. • The magnitude displayed on the DMM a modified version of VRMS where the DC offset is discarded. Thus, on your DMM VRMS for V1(t) = V2(t), which is not what you will find using the Analog Discovery. D. Fritz and E. Robertson
Oscilloscope Basics • The scope graphically displays a time-varying voltage waveform. • Time-varying current measurements are calculated from the voltage measurements. • The scope can be used to determine the amplitude, frequency, period, phase, DC and AC components, noise, shape, and other parameters of the voltage signal. • NOTE: An oscilloscope is designed to capture and display time- varying waveforms. It is not the best instrument for measuring DC voltages! Use your DMM for DC measurements. • Analog Devices University site has some interesting comments and projects as does the Digilent Analog Discovery webpage D. Fritz and E. Robertson
Displaying the input waveform. • An A→D converter captures a series data points on the waveform. The 14 bit samples provide a resolution of 16,384 possible voltage levels. • These points are stored in memory and then displayed on the screen, using interpolation to smooth the waveform shape between data points. • The accuracy and resolution depend on the vertical scale selected. For best measurement accuracy, you should always try to display the waveform as close to full scale as possible. D. Fritz and E. Robertson
Main Oscilloscope Components • Vertical display controlsScales the input voltage to set the size and position of the waveform. • Horizontal display controlsSets the “sweep rate” (time / division) and adds a horizontal position control. • Trigger System and controlsIf the horizontal sweep begins randomly, the waveform moves around. The trigger stabilizes the waveform by controlling where, on a waveform’s voltage and slope, the display trace begins each time. • This scope also has a built-in arbitrary waveform generator, also known as a signal generator. D. Fritz and E. Robertson
Digilent Analog Discovery Scope Display D. Fritz and E. Robertson
Input Pins for Channel 1 and 2 of the Oscilloscope • Analog Discovery is a dc-coupled differential-input dual-channel oscilloscope, which means that it has two pair of inputs for the scope. • Channel 1 is pins 1 and 16 (bottom most pair in the photo to the left). • 1+ is pin 1 - orange wire • 1- is pin 16 - orange wire with white marking • Channel 2 is pins 2 and 17 (the pair of wires that is second from the bottom in the photo). • 2+ is pin 2 - blue wire • 2- is pin 17 - bluewire with white marking D. Fritz and E. Robertson
Complete Pin-Out for Analog Discovery D. Fritz and E. Robertson Image provided by Digilent, Inc.
What does this mean? • Dual channel • Two time-varying voltage signals can be measured simultaneously. • Measurements of the voltage source powering the circuit and a voltage elsewhere in the circuit are very commonly measured at the same time. • Differential input • The input to the oscilloscope is a differential amplifier. The measurement is the voltage on the positive input (1+ or 2+) minus the voltage on the negative input (1- or 2-). • To measure the voltage at a node with respect to ground, you have to connect the positive input of Channel 1 or Channel 2 to the node and connect the negative input of the same channel to the ground in the circuit – not the ground on the Analog Discovery unless you have are using one of the ground the Arbitrary Function Generator or fixed DC voltage supplies of the Analog Discovery in your circuit. • DC Coupled • The voltage measurement contains the DC as well as AC component of the voltage measurement. • If the DC term is very large in comparison to the AC term, you may have to add a high-pass filter in front of your oscilloscope or mathematically remove the DC component. This will be covered in the Advanced_Scope presentation. D. Fritz and E. Robertson
Collecting Data Single captures the time-varying signal once, which is then displayed on the graph. While this is convenient because the graphical display doesn’t change, the initial set of data may not represent the steady-state condition of the circuit – or show you that there isn’t a steady-state condition. Nor does the display update when a change is made to the circuit. Run continuously captures and displays the time-varying signal. This is the better option to use for most of the introductory circuits experiments. However, the display can be ‘jumpy’ if the time base for the oscilloscope measurement and the frequency of the time-varying signal are not in synch. Triggering (described on Slides 13-14) is used to force the display to be stationary. Once you click Single or Run, the word Stop will appear in its place. It will switch back to Single once the data has been collected. Click on Stop to halt the collection of data in the continuous Run mode. D. Fritz and E. Robertson
Vertical controls • Turn the channel display on and off using the Check box. • Set the vertical scale (Volts/Div )from drop menu. • Set vertical position (drag arrow on graph) • Autoset can be friend or foe! • To determine if avalid signal is displayed on the graph, you need to understand what your Analog Discovery is measuring and the settings that are used during the measurement. D. Fritz and E. Robertson
Horizontal controls • To the right of the waveform display area is the Time/Div. horizontal scale settingmenu. • TheRunbutton enables the Horizontal display. • The single button is used to display a single horizontal capture. • To the right of the waveform display area is a menuselection and at the top of the waveform display is ablack arrow, which you can change tomove the waveform sideways along the horizontal scale. D. Fritz and E. Robertson
Trigger controls • Turn the trigger on and off using the menu. If the trigger is off (says “none”), the display will free run. The displayed graph may jump around if the refresh rate of your computer screen and the frequency of the measured signal are not in sync. • If the trigger is on: • Select the trigger source from the Source menu. If you are only looking at one signal, then this is the channel that you select. • Select whether to trigger on rising edge or falling edge of the waveform in the Cond. menu. • Adjust the trigger voltage level from the menu or using the sliding arrowon the graph until you see the word Trig’d in the box on the upper left. D. Fritz and E. Robertson
Trigger markers tell you what the trigger is doing. • There is a marker on the right hand edge of the scope waveform display that corresponds to the waveform’s trigger voltage level. • If you hover over the orange arrow, text will be displayed on the left-hand side of the graph that will state which channel is being used to trigger the display and what the trigger voltage level is. • In this example, Channel 1 (C1) and 0 V are the trigger channel and trigger voltage level, respectively. D. Fritz and E. Robertson
Visually measuring the waveform On the scope display, Vmax, Vmin, Vpp, and the period (T) can be obtained by • counting the number of divisions • multiplying by the vertical scale for voltages • multiplying by the horizontal scale for time period. Horiz Scale Vert Scale VmaxApprox 2.5 div up from GND x 2V/div = +5V Period T Approx 2 div x 500us/div = 1 ms GND (0V) location for CH1 VminApprox 2.5 div down from GND x 2V/div = -5V D. Fritz and E. Robertson
Measure the Waveform Parameters • Click Measure…This opens a window for measurements. • Select a channeland then double click on the Type of measurement that you would like to have displayed or click on the sign to the left of Vertical (measurements associated with the voltage amplitude), Horizontal (measurements associated with the period or frequency of the signal), or Device (information on the exact operation of the Analog Discovery for the graphed voltage signal). D. Fritz and E. Robertson
Displaying Measurements Double click on the name of the measurement in the drop-down menu under Type and the measurement name and its value along with the channel number will appear in a Measurements window along side the plot of the time-varying signal. Click Addto bring up the Add Measurement pop-up window if there are some other measurements that you would like displayed after you close the Add Measurements window. If you only single click on the name, the value will be displayed at the bottom of the Add Measurement pop-up window. Click on the measurement name and then the to delete one of the measurements from the list in the Measurements window. D. Fritz and E. Robertson
Measurement Accuracy • There is greater accuracy to a measurement of voltage amplitude and offset made on a waveform that vertically occupies most of display as compared to a waveform that is small on the display. • The best accuracy for time-based parameters seems to require at least two cycles of the waveform to be displayed on the horizontal axis. • The measured values will be reasonably accurate as long as the scope display is running. • If you see “?” after the value, the waveform measurement does not fit into the display window and/or is outside of the measurement range. • If you have “Waiting for trigger” showing, any changes to the waveform will not appear on the graphical display and the measurements of the Waveform Parameters will not be updated for the actual voltage signal in the circuit. D. Fritz and E. Robertson
Using Cursors To obtain data at specific points on the displayed voltage versus time graphs, you can use cursors. To activate the cursors, click and drag the X or Y in the corners of the graph into the graph. A vertical line will appear when you click and drag X into the graph and a horizontal line will appear when you click and drag Y.There are two each of the X and Y cursers. In this example, the X cursor has been dragged on to the graph. The text printed along the cursor are the voltage measurements at the point on the x-axis where the X cursor crosses. Clicking near the X cursor will cause a balloon to open, which contains the same information The voltage at the intersection of the X and Y cursors is shown when you click on the Y cursor. To remove the cursor from the graph, click on X1or on the cursor itself and move it back to X. D. Fritz and E. Robertson
Measurement of Differences in Time To find the difference in time between two points in time on a curve, position the two vertical lines by click-and-dragging each line to the appropriate point on the trace. Note that the order of the values for X1 and X2 in the second larger box as well as in the lower left of the scope window (only when you click on one or the other cursor) will switch when X1 is located at a time larger than X2. dXis the absolute value of the difference in time between the two vertical cursors. 1/dXis the reciprocal of that difference in time, expressed in Hz. D. Fritz and E. Robertson
Measurement of Differences in Voltage To find the voltage difference between two points on the same graph (which can be on the same signal, a signal and a reference voltage, or one on each signal), position the two horizontal lines by click-and-dragging each cursor to the appropriate point on the trace. The text displayed with the lower cursor includes the voltage difference between the two cursors. dYis the absolute value of the difference in voltage between the two horizontal cursors. The Y1 and Y2 values are the voltages of the lines D. Fritz and E. Robertson