Download
1 / 12
120 likes | 217 Views
Potential Controls on Trends in Background Concentrations of Hg in the Northeastern US. Huiting Mao Department of Chemistry State University of New York College of Environmental Science and Forestry. Thompson Farm – TF, Durham, NH, sea level

E N D
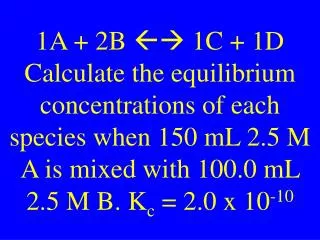
Potential Controls on Trends in Background Concentrations of Hg in the Northeastern US Huiting Mao Department of Chemistry State University of New York College of Environmental Science and Forestry
Thompson Farm – TF, Durham, NH, sea level Pack Monadnock – PM, Pack Monadnock, NH, 700 asl Huntington Wildlife Forest – HWF, Adirondacks, NY, 510 m asl
3.8±0.9 ppqv yr-1 Mace Head: 3.1±1.1 ppqv yr-1 Ebinghaus et al.(2011) Pack Monadnock Cape Point South Africa 3.8±0.6 ppqv yr-1, Slemret al. (2011) Canadian mid-latitude sites ~2.6 – 3.9 ppqv yr-1 Cole et al. (2013) Huntington Thompson Farm
Pack Monadnock Thompson Farm Huntington • In colder months the trends were more associated with anthropogenic emission reductions; • In warmer months other sources/sinks and processes became more significant and even predominant.
For the overlapping period February 2006 – August 2010 HWF: -1.8 ± 3.4 ppqv yr-1 TF: -0.8 ± 1.9 ppqv yr-1 PM: -3.6 ± 1.4 ppqv mon-1
a) TF Hg0 MMAs corresponding to 75th percentile CO mixing ratios at TF and PM 2.0±0.8 ppqv yr-1 b) PM 4.8±0.7 ppqv yr-1 c) HWF 95thpercentile Hg0 MMAs at HWF 3.5±1.3 ppqv yr-1
PM GEM in Polluted Air Masses (CO>75th percentile) TF (CO> 75th percentile) Figure 6. HWF (95th percentile) For TF, other sources/processes in warmer months could overtake anthropogenic influence.
Background Concentrations Pack Monadnock Huntington Thompson Farm
a) TF Anthropogenic Contribution 2.1 ± 0.6 ppqv yr-1 b) PM 1.6 ± 0.6 ppqv yr-1 c) HWF 22 ±6 ppqv yr-1
TF Wet Deposition Lombard et al., 2011, acp
Acknowledgments This study was funded by NSF AGS 1141713 and EPA STAR 83521501


![Chapter 7: Computer-Assisted Audit Techniques [CAATs]](https://cdn0.slideserve.com/534186/chapter-7-computer-assisted-audit-techniques-caats-dt.jpg)