Download
1 / 1
10 likes | 142 Views
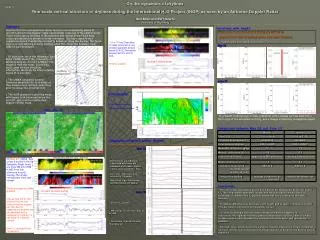
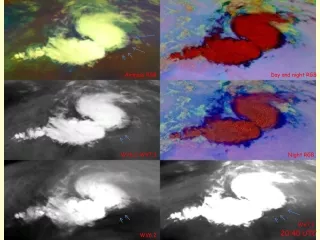
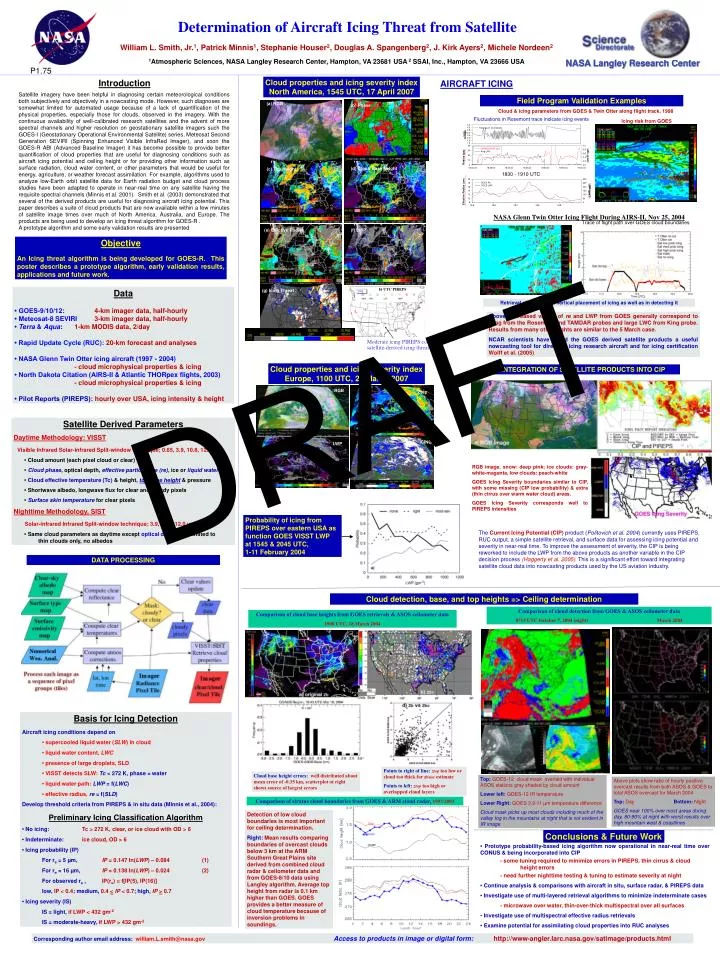
(a) RGB. (b) Phase. (d) Cloud Base Height. (c) Top Height. (e) Effictive Radius. (f) LWP. Voltage. Radius (um). LWc (g/m3). 1830 - 1910 UTC. Effective Radius (um). LWP (g/m2). RGB. Ztop. ICING. LWP. 16 UTC PIREPS. (g) Icing Threat.

E N D
(a) RGB (b) Phase (d) Cloud Base Height (c) Top Height (e) Effictive Radius (f) LWP Voltage Radius (um) LWc (g/m3) 1830 - 1910 UTC Effective Radius (um) LWP (g/m2) RGB Ztop ICING LWP 16 UTC PIREPS (g) Icing Threat NASA Glenn Twin Otter Icing Flight During AIRS-II, Nov 25, 2004 Retrieval shows skill in vertical placement of icing as well as in detecting it Determination of Aircraft Icing Threat from Satellite William L. Smith, Jr.1, Patrick Minnis1, Stephanie Houser2, Douglas A. Spangenberg2, J. Kirk Ayers2, Michele Nordeen2 1Atmospheric Sciences, NASA Langley Research Center, Hampton, VA 23681 USA 2 SSAI, Inc., Hampton, VA 23666 USA NASA Langley Research Center P1.75 Introduction Cloud properties and icing severity index North America, 1545 UTC, 17 April 2007 AIRCRAFT ICING Satellite imagery have been helpful in diagnosing certain meteorological conditions both subjectively and objectively in a nowcasting mode. However, such diagnoses are somewhat limited for automated usage because of a lack of quantification of the physical properties, especially those for clouds, observed in the imagery. With the continuous availability of well-calibrated research satellites and the advent of more spectral channels and higher resolution on geostationary satellite imagers such the GOES-I (Geostationary Operational Environmental Satellite) series, Meteosat Second Generation SEVIRI (Spinning Enhanced Visible InfraRed Imager), and soon the GOES-R ABI (Advanced Baseline Imager) it has become possible to provide better quantification of cloud properties that are useful for diagnosing conditions such as aircraft icing potential and ceiling height or for providing other information such as surface radiation, cloud water content, or other parameters that would be useful for energy, agriculture, or weather forecast assimilation. For example, algorithms used to analyze low-Earth orbit satellite data for Earth radiation budget and cloud process studies have been adapted to operate in near-real time on any satellite having the requisite spectral channels (Minnis et al. 2001). Smith et al. (2003) demonstrated that several of the derived products are useful for diagnosing aircraft icing potential. This paper describes a suite of cloud products that are now available within a few minutes of satellite image times over much of North America. Australia, and Europe. The products are being used to develop an icing threat algorithm for GOES-R . A prototype algorithm and some early validation results are presented Field Program Validation Examples Cloud & icing parameters from GOES & Twin Otter along flight track, 1998 Fluctuations in Rosemont trace indicate icing events Icing risk from GOES Trace of flight path over GOES cloud boundaries Objective An Icing threat algorithm is being developed for GOES-R. This poster describes a prototype algorithm, early validation results, applications and future work. DRAFT Data • GOES-9/10/12: 4-km imager data, half-hourly • Meteosat-8 SEVIRI 3-km imager data, half-hourly • Terra & Aqua: 1-km MODIS data, 2/day • Rapid Update Cycle (RUC): 20-km forecast and analyses • NASA Glenn Twin Otter icing aircraft (1997 - 2004) - cloud microphysical properties & icing • North Dakota Citation (AIRS-II & Atlantic THORpex flights, 2003) - cloud microphysical properties & icing • Pilot Reports (PIREPS): hourly over USA, icing intensity & height Above: increased values of re and LWP from GOES generally correspond to icing from the Rosemont and TAMDAR probes and large LWC from King probe. Results from many other flights are similar to the 5 March case. NCAR scientists have found the GOES derived satellite products a useful nowcasting tool for directing icing research aircraft and for icing certification Wolff et al. (2005) Moderate icing PIREPS confirm satellite-derived icing threat Cloud properties and icing severity index Europe, 1100 UTC, 21 March 2007 INTEGRATION OF SATELLITE PRODUCTS INTO CIP Satellite Derived Parameters Daytime Methodology: VISST Visible Infrared Solar-infrared Split-window technique; 0.65, 3.9, 10.8, 12.0 µm • Cloud amount (each pixel cloud or clear) • Cloud phase, optical depth, effective particle size (re), ice or liquid water path • Cloud effective temperature (Tc) & height, top/base height & pressure • Shortwave albedo, longwave flux for clear and cloudy pixels • Surface skin temperature for clear pixels Nighttime Methodology, SIST Solar-infrared Infrared Split-window technique; 3.9, 10.8, 12.0 µm • Same cloud parameters as daytime except optical depth (OD) limited to thin clouds only, no albedos RGB image, snow: deep pink; ice clouds: gray-white-magenta, low clouds: peach-white GOES Icing Severity boundaries similar to CIP, with some missing (CIP low probability) & extra (thin cirrus over warm water cloud) areas. GOES Icing Severity corresponds well to PIREPS intensities Probability of icing from PIREPS over eastern USA as function GOES VISST LWP at 1545 & 2045 UTC, 1-11 February 2004 The Current Icing Potential (CIP) product (Politovich et al. 2004) currently uses PIREPS, RUC output, a simple satellite retrieval, and surface data for assessing icing potential and severity in near-real time. To improve the assessment of severity, the CIP is being reworked to include the LWP from the above products as another variable in the CIP decision process (Haggerty et al. 2005). This is a significant effort toward integrating satellite cloud data into nowcasting products used by the US aviation industry. DATA PROCESSING Cloud detection, base, and top heights => Ceiling determination Comparison of cloud detection from GOES & ASOS ceilometer data 0715 UTC October 7, 2004 (night) March 2004 Comparison of cloud base heights from GOES retrievals & ASOS ceilometer data 1900 UTC, 18 March 2004 Basis for Icing Detection Aircraft icing conditions depend on • supercooled liquid water (SLW) in cloud • liquid water content, LWC • presence of large droplets, SLD • VISST detects SLW: Tc < 272 K, phase = water • liquid water path: LWP = f(LWC) • effective radius, re = f(SLD) Develop threshold criteria from PIREPS & in situ data (Minnis et al., 2004): Preliminary Icing Classification Algorithm • No icing: Tc > 272 K, clear, or ice cloud with OD > 6 • Indeterminate:ice cloud, OD > 6 • Icing probability (IP) For re = 5 µm,IP = 0.147 ln(LWP) – 0.084 (1) For re = 16 µm,IP = 0.138 ln(LWP) – 0.024(2) For observed re ,IP(re) = f[IP(5), IP(16)] low, IP < 0.4; medium,0.4 <IP < 0.7; high,IP> 0.7 • Icing severity (IS) IS = light, if LWP < 432 gm-2 IS = moderate-heavy, if LWP > 432 gm-2 Points to right of line:ztop too low or cloud too thick for zbase estimate Points to left:ztop too high or overlapped cloud layers Cloud base height errors: well distributed about mean error of -0.35 km, scatterplot ot right shows source of largest errors Top: GOES-12 cloud mask overlaid with individual ASOS stations gray shaded by cloud amount Lower left:GOES-12 IR temperature Lower Right:GOES 3.9-11 µm temperature difference Cloud mask picks up most clouds including much of the valley fog in the mountains at night that is not evident in IR image Above plots show ratio of hourly positive overcast results from both ASOS & GOES to total ASOS overcast for March 2004 Top: DayBottom:Night GOES near 100% over most areas during day, 80-90% at night with worst results over high mountain west & coastlines Comparison of stratus cloud boundaries from GOES & ARM cloud radar, 1997-2003 Detection of low cloud boundaries is most important for ceiling determination. Right: Mean results comparing boundaries of overcast clouds below 3 km at the ARM Southern Great Plains site derived from combined cloud radar & ceilometer data and from GOES-8/10 data using Langley algorithm. Average top height from radar is 0.1 km higher than GOES. GOES provides a better measure of cloud temperature because of inversion problems in soundings. Conclusions & Future Work • • Prototype probability-based icing algorithm now operational in near-real time over CONUS & being incorporated into CIP • - some tuning required to minimize errors in PIREPS, thin cirrus & cloud height errors • - need further nighttime testing & tuning to estimate severity at night • • Continue analysis & comparisons with aircraft in situ, surface radar, & PIREPS data • • Investigate use of multi-layered retrieval algorithms to minimize indeterminate cases • - microwave over water, thin-over-thick multispectral over all surfaces • Investigate use ofmultispectral effective radius retrievals • • Examine potential for assimilating cloud properties into RUC analyses Corresponding author email address: william.L.smith@nasa.govAccess to products in image or digital form:http://www-angler.larc.nasa.gov/satimage/products.html