Download
1 / 5

E N D
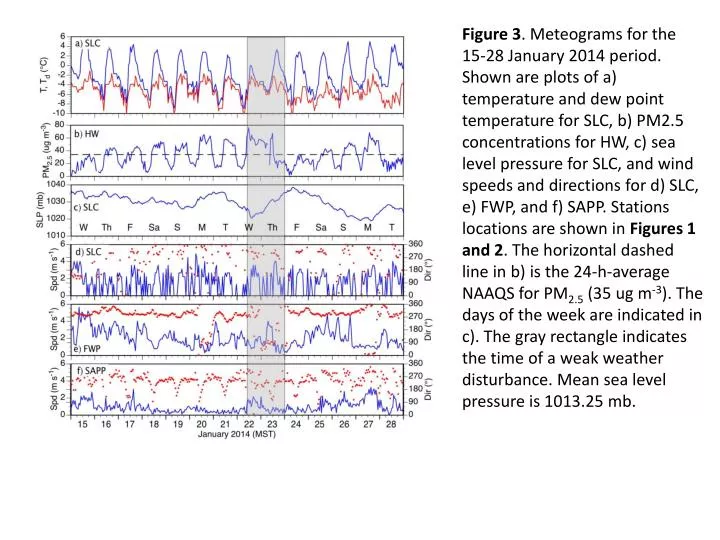
Figure 3. Meteograms for the 15-28 January 2014 period. Shown are plots of a) temperature and dew point temperature for SLC, b) PM2.5 concentrations for HW, c) sea level pressure for SLC, and wind speeds and directions for d) SLC, e) FWP, and f) SAPP. Stations locations are shown in Figures 1 and 2. The horizontal dashed line in b) is the 24-h-average NAAQS for PM2.5 (35 ug m-3). The days of the week are indicated in c). The gray rectangle indicates the time of a weak weather disturbance. Mean sea level pressure is 1013.25 mb.
Figure x. Vertical potential temperature profiles at 3-hour intervals (00 through 21 MST) for a mean cold-air pool day as composited from hourly data from 16, 17, 18, 19, 24 and 25 January 2014 for a) Bingham Canyon Mine and b) Salt Lake Valley. c) is the BCM-SLV potential temperature difference.
Figure x. Mean column-averaged temperature differences between the Bingham Canyon Mine and the Salt Lake Valley, as composited at 3-h intervals from hour- averaged HOBO data on 16, 17, 18, 19, 24, and 25 January 2014. [ADD THE 0000 POINT AGAIN AT 2400 MST]
Figure 7. Analyses of hour-average pseudo-vertical a) temperature structure contours for the Bingham Mine atmosphere, and b) temperature differences between the Bingham Mine and Salt Lake Valley atmospheres.