Download
1 / 24
270 likes | 444 Views
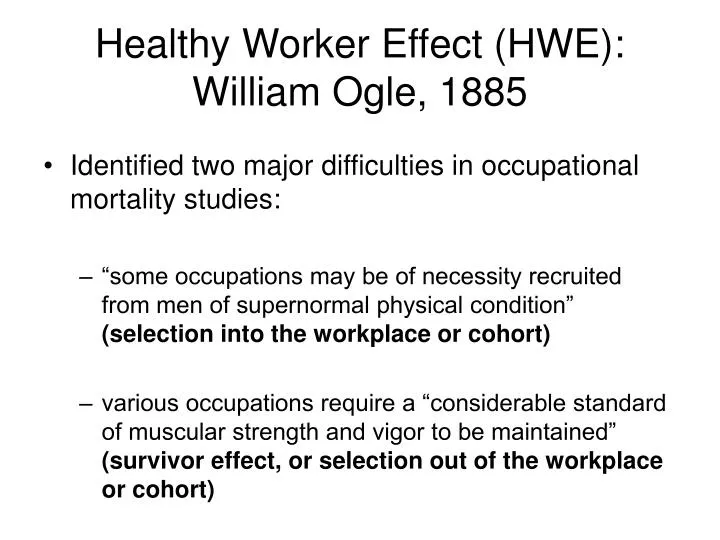
Healthy Worker Effect (HWE): William Ogle, 1885. Identified two major difficulties in occupational mortality studies: “some occupations may be of necessity recruited from men of supernormal physical condition” (selection into the workplace or cohort)

E N D
Healthy Worker Effect (HWE):William Ogle, 1885 • Identified two major difficulties in occupational mortality studies: • “some occupations may be of necessity recruited from men of supernormal physical condition” (selection into the workplace or cohort) • various occupations require a “considerable standard of muscular strength and vigor to be maintained” (survivor effect, or selection out of the workplace or cohort)
Healthy Worker Effect (HWE):William Ogle, 1885 • Ogle recognized that the bias from these two difficulties was in the same direction: bias away from the null and towards lower than expected mortality and morbidity rates
Healthy Worker Effect (HWE) • A pervasive problem in occupational mortality and morbidity studies • Leads to underestimates of, (or may totally obliterate), exposure-disease associations • Leads to distortion of dose-response relationships • General principle for minimizing HWE bias: • make exposure-disease comparisons among those similarly affected by the bias
Sources of Healthy Worker Effect Healthy Hire Effect • Initial selection of healthy individuals at time of hire so that their disease risks differ from the disease risks in the source (general) population • Hiring is dependent upon passing a pre-employment medical examination • Self-selection of individual (able to apply for the job) • Bias occurs when comparing disease rates between the worker cohort and the general population • Effect is greatest during the initial period of follow-up and diminishes to some extent over time • Bias: lower than expected mortality/morbidity rates
Sources of Healthy Worker Effect Time-Since-Hire Effect • Decline in health with time (e.g., >15 years) since hire (the effect of the initial selection in the hiring process wears off over time) • Bias occurs because lower cumulative exposure categories include more recent hires than higher cumulative exposure categories • Increasing time-since-hire is correlated with increasing cumulative exposure • Higher cumulative exposure categories appear to be associated with higher disease risks even when no exposure-disease relationship exists • Bias is away from null leading to an overestimate of the health effect at higher cumulative exposure levels
Sources of Healthy Worker Effect Healthy Survivor Effect • a continuing selection process in the workplace • Survival of healthier individuals in the active workforce (a selective retention of healthy workers in the workforce) • Selection out of unhealthy (symptomatic) workers from workforce (health-related job mobility or termination) • Terminate employment • Transfer to jobs with lower exposures
Sources of Healthy Worker Effect Healthy Survivor Effect • Can be viewed as a confounder: • Terminating employment (or transfer to a less exposed job) is related to future exposure • Terminating employment is an independent risk factor for disease • Beneficial effects to health of continued employment: • Improved access to health care • Higher standard of living • Physical exercise • Routine disease screening at workplace • Job transfer may be related to health and exposure status • Workers realize exposure is causing health problems and transfer to lower/no exposure jobs
Sources of Healthy Worker Effect Healthy Survivor Effect • Can also be viewed as a selection bias • Impact on a cross-sectional study of a cohort: • Study includes only workers remaining in the workplace (“active workers”) – a survivor (healthier) population • Less healthy workers leave (i.e., are selected out of) the workplace prior to the study and are therefore not included in the study • Bias: effects of exposure are underestimated • Impact on longitudinal (prospective/retrospective) cohort study: • Healthier workers remain in the workplace and therefore generally have higher cumulative exposures than less healthy workers who leave the workplace or transfer to less exposed jobs • Effects of increasing cumulative exposure are underestimated • The bias is not due to a loss to follow-up, since those who leave work are not usually lost to follow-up.
Sources of Healthy Worker Effect Healthy Survivor Effect Bias • Leads to lower than expected disease rates • When there is no exposure-disease relationship, (and even after stratifying by time-since-hire), higher cumulative exposure appears protective of health: • Workers with longer employment history will, on average, have higher cumulative exposures than workers with shorter employment history, and • Since workers with shorter employment history tend to be less healthy due to the healthy survivor effect, higher cumulative exposures can appear to have a protective effect
Sources of Healthy Worker Effect • Some industries may accept workers with social problems, unhealthy habits, or health problems • contributes to healthy survivor effect bias • Some industries will not hire such workers • contributes to healthy hire effect bias • Some factors affecting hiring practices: • Unemployment rate • Prevalence of pre-employment health exams • Availability of other social “safety net” programs • Physical requirements of the job • If selection into subgroups of job tasks or exposures within the cohort is based on health status of the worker at time of hire, then internal comparisons may be biased (“internal healthy hire effect bias”)
Sources of Healthy Worker Effect • The effects of healthy worker effect biases may vary by • Gender • Race/ethnicity • Social class • Work status • Age at hire • Length of employment • Length of follow-up • Type of occupation • Cause of mortality/morbidity
Healthy Worker Effect:Impact on measures of effect • Impact (bias) on effect measures is most striking for: • morbidity measures • pulmonary function, respiratory symptoms • neurobehavioral symptoms • workplace injuries • mortality measures • all causes of death combined • nonmalignant chronic conditions (e.g., heart disease) • Impact is less striking for cancer endpoints
Retrospective Cohort Study of polyvinyl chloride manufacturing workers, 1940-1974:Healthy Hire Effect
Retrospective Cohort Study of polyvinyl chloride manufacturing workers, 1940-1974:Healthy Survivor Effect
Healthy Worker Effect (HWE):Impact on measures of effect Why is HWE bias greater for nonmalignant morbidity/mortality? • Symptoms usually accompany these conditions • Asymptomatic individuals are: • more likely to be hired • more likely to remain actively employed • less likely to either leave the workplace or transfer to a job with lower exposures
Minimizing Healthy Worker Effect Biases • Minimizing Healthy Hire Effect Bias • Make comparisons internal to the cohort • e.g., compare disease rates among different exposure categories within the cohort • Internal comparisons minimize this bias because: • All cohort members passed through similar hiring process • Differences in the distribution of confounders (e.g., smoking status) within the cohort are much smaller than differences between the cohort and the general (source) population • Avoid combining all causes of mortality
Minimizing Healthy Worker Effect Biases • Minimizing Time-Since-Hire Effect Bias • Internal comparisons alone cannot solve the problem • Stratify by time-since-hire • Compare cumulative exposure groups (e.g., high vs low cumulative exposure) among those with shorter time since hire • Compare cumulative exposure groups among those with longer time since hire • Stratify by age (currrent or at hire) and work status (active/inactive) instead of time-since-hire
Minimizing Healthy Worker Effect Biases • Minimizing Healthy Survivor Effect Bias • The most difficult of the healthy worker effect biases to minimize • Making internal comparisons and stratifying by time-since-hire are not sufficient to minimize this bias • General principle: make comparisons among those who are similarly affected by the healthy survivor effect bias
Possible strategies to Minimize Healthy Survivor Effect Bias • Restrict analysis to those who survive and are followed up for at least 10-15 years since time of hire • Disadvantages: • loss of statistical power due to smaller numbers after restriction • Assumes healthy survivor effect is minimal after 10-15 years, but there is no evidence that this is the case.
Possible strategies to Minimize Healthy Survivor Effect Bias • Stratify by employment status: active vs inactive • Disadvantage: • “Inactive” group has heterogeneous disease risks, since the “inactive” worker may be: • employed elsewhere • disabled • retired • voluntarily unemployed or involuntarily unemployed • Solution: • obtain data to distinguish those who are “off-work” from those who are employed elsewhere • If data are unavailable, stratify by current age (a proxy for retired vs other “inactive”) • Stratify by time since transfer to deal with workers who transferred for health reasons
Possible strategies to Minimize Healthy Survivor Effect Bias • Stratify by employment status: active vs inactive • Disadvantage: • Cross-sectional studies only include active workers, and there is no data on the health status of inactive workers • Solution: • Transform prevalence data into incidence data: • use self-reported year of first onset of symptoms to determine yearly incidence rates • compare incidence rates among the exposure groups for each year prior to the cross-sectional survey • Focus on incidence rates one to two years prior to the survey date
Example of transforming prevalence data into incidence data by using self-reported year of onset to determine yearly incidence rates: persistent pain from repetitive motion among garment workers
Possible strategies to Minimize Healthy Survivor Effect Bias • Lag exposures: ignores recent exposures • Motivation: Since only the healthier workers survived on the job to receive recent exposures, ignore the recent exposures to eliminate the relationship between exposure and job survival. • This is the same procedure as assuming a latency period for a disease, except that the motivation for defining a latency period has to do with the exposure-disease process, not the exposure-job survival relationship
Possible strategies to Minimize Healthy Survivor Effect Bias • Lag exposures • Disadvantages: • Assumes that the period in which the healthy survivor bias operates is shorter than the exposure lag time (or latency period) • Assumes time “off work” is equivalent to time “on work” at zero exposure • Empirical results indicate that this approach works as well or better than stratifying on employment status in dealing with bias due to termination of employment for health reasons