Download
1 / 44
440 likes | 446 Views
Neuro-imaging applications in Psychiatry. Professor David Wyper Institute of Neurological Sciences Glasgow d.wyper@udcf.gla.ac.uk. X-ray Computed Tomography. X-ray Computed Tomography. Transmission tomography. Developed at EMI laboratories in 1972 by Godfrey Houndsfield. CT in psychiatry.

E N D
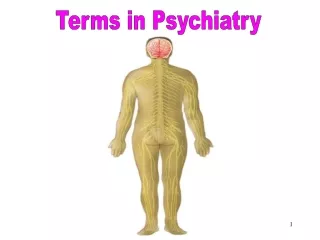
Neuro-imaging applications in Psychiatry Professor David Wyper Institute of Neurological Sciences Glasgow d.wyper@udcf.gla.ac.uk
X-ray Computed Tomography Transmission tomography Developed at EMI laboratories in 1972 by Godfrey Houndsfield
CT in psychiatry Dementia Control Alzheimer’s Hippocampal atrophy
Magnetic resonance imaging • MRI imaging • MRA angiography • MRS spectroscopy • fMRI functional • DTI diffusion tensor
Tissue contrast MRI ‘pulse sequences’ control the transmission of radio signals and the timing of detection of signals emitted from the body.
Magnetic Resonance Imaging • MRI can image structures with detail of 0.1mm. • MRI can be repeated without limit. • MRI has an enormous impact on clinical in-vivo research
MR in psychiatry Alzheimer’s disease - progression Normal ageing difference at 12m Early onset AD difference at 12m
CSF volume in Schizophrenia Control Schizophrenia
Reduction in gray matter in schizophrenia McIntosh AM….Lawrie SM and Johnstone EC Voxel-based Morphometry of Patients with Schizophrenia or Bipolar Disorder and their Unaffected Relatives, Biol Psychiatry 2004;56:544-552
MR in psychiatry • Schizophrenia - activation; Diffusion imaging
Functional MRI • In response to a local increase in neuronal firing there is an increase in oxyhaemoglobin - HbO2 [red] • HbO2 is diamagnetic • If HbO2 increases then T2 relaxation gets longer and the MRI signal increases • fMRI uses a BOLD [Blood Oxygen Level Dependent] MRI pulse sequence
functional MRI of motor function Paradigm: * stimulus every 12 seconds * if ‘2’ press; if ‘5’ don’t press
Anterior cinulate Inferior frontal cortx Anticipation Goalmouth vs open play Hedonia Goal vs Miss Inferior putamen & amygdala Lateral temporal cortex
Diffusion imaging A Einstein. Investigation of the theory of Brownian motion: Dover; New York, 1956
MRI: diffusion imaging Isotropic diffusion Examples: Glass of water; cerebral grey matter Anisotropic diffusion Examples: textile fibres, nerve fibres
SPECT SPECT PET In-vivo molecular imaging The purpose of molecular imaging is to improve understanding of biology and medicine through non-invasive in vivo investigation of cellular molecular events involved in normal and pathologic processes. The technologies range from experimental optical fluorescence imaging to clinical PET and SPECT
In emission tomography a tracer in injected intravenously and delivered by blood-flow to the organ of interest
The patient’s view Gamma ray detectors Intravenus injection of radio-pharmaceutical Duration 30-40 minutes
Positron emission tomography For more info on PET see: http://www.crump.ucla.edu/software/lpp/lpphome.html
PET SPECT PET / SPECT
Positron Emission Tomography [PET] 11C or 18F Short half life Local cyclotron Good for study of drug delivery Single Photon Emission Tomography [SPECT] 99mTc or 123I Longer half life Can buy isotopes Good for study of drug action Emission Tomography Both techniques are based on detection of gamma rays emitted from the body after injection of a tracer.
What SPECT can measure • Regional brain function: perfusion • Dopamine D2 receptor availability • Dopamine transporter function • M1 muscarinic receptors • Nicotinic receptors Same scanner: different radio-pharmaceuticals
SPECT imaging of blood supply in the brain The tracer 99mTc -HMPAO can measure the amount of blood that goes to each part of the brain. It is extracted from blood passing through the brain and trapped in brain cells. Uptake in neurones High flow Low flow Time injection 60 seconds
The probability that patients with memory loss and normal perfusion had Alzheimer's disease was 19 %. The probability of Alzheimer's disease with bilateral temporo-parietal defects was 82% The AD perfusion pattern
Frontal lobe dementia • Frontal hypo-perfusion sometimes including temporal lobes Frontal lobe dementia Alzheimer’s disease Bi-lateral temporo-parietal deficits Bi-lateral frontal lobe deficits
Vascular dementia • Multiple regions of focally reduced perfusion
The dopamine neurotransmitter system Tyrosine Dopamine synthesis L-DOPA DA Pre-synaptic terminal Vesicles Glial cell Dopamine MAO-B Transporters COMT D2 Receptors Post-synaptic cell
Dopamine neurotransmitter tracers Tyrosine L-DOPA F18-Dopa DA Pre-synaptic terminal Glial cell Vesicles MAO-B COMT I123 IBZM or epidepride I123 FPCIT or ß-CIT Post-synaptic cell
Diagnosis and staging of PD and LBD Imaging diagnosis Clinical diagnosis • Accuracy of Diagnosis in Presumed PDMeara J et al Age and Ageing 1999;28:99-102 • . • 26% of patients receiving inappropriate treatment • Post-mortem data suggests figure may even be higher Even on first presentation SPECT shows loss of 50% of neurones Objective measurement of progression in assessment of therapy Normal PD: H&Y1 PD: H&Y2 PD: H&Y3
Molecular Imaging of drug action SPECT images of SERT binding
Measurement of drug action Serotonin reuptake inhibitor (SSRI) SPECT tracer Image available binding sites Modern antidepressant drugs (SSRIs) block the serotonin transporter (SERT) Pre-synaptic terminal Serotonin transporters (SERT) Synapse Serotonin Post-synaptic cell
Measurement of drug action before antidepressant after antidepressant