Download
1 / 13
130 likes | 239 Views
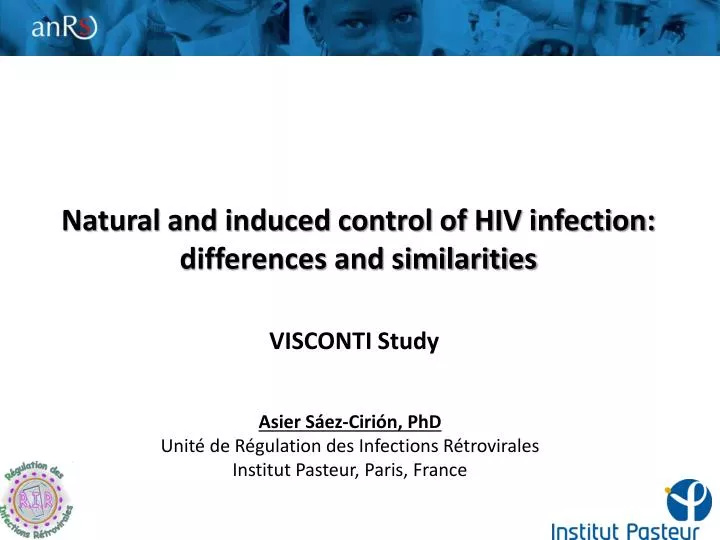
Natural and induced control of HIV infection: differences and similarities. VISCONTI Study. Asier Sáez-Cirión , PhD Unité de Régulation des Infections Rétrovirales Institut Pasteur, Paris, France. HIV controllers and Post-treatment controllers different ways for a similar outcome.

E N D
Natural and induced control of HIV infection: differences and similarities VISCONTI Study AsierSáez-Cirión, PhD Unité de Régulation des Infections Rétrovirales Institut Pasteur, Paris, France
HIV controllers and Post-treatment controllers different ways for a similar outcome HIV controllers (HIC): infected individuals spontaneously controlling HIV-1 infection Post-treatment controllers (PTC): infected individuals controlling HIV-1 infection after interruption of cART 9 10 2000 8 10 7 10 6 1500 10 1000 2500 5 10 CD4+ T cells/mm3 HIV-1 RNA (copies/ml plasma) 4 1000 10 800 2000 3 10 600 1500 2 10 500 CD4 T cell counts/µl HIV-1 RNA (copies/ml plasma) 1 400 10 1000 0 10 0 200 14 patients Months on cART : 36.5 (12-92) Months post-cART: 89 (48-115) 500 01 02 03 04 05 06 07 08 09 10 At least 5 years of infection, naïve of cARV, maintain 5 last viral loads < 400 copies Year 0 0 1995 2000 2005 2010 1990 Therapy started within 10 weeks following Primary Infection (median39 days p.i.) Saez-Cirion et al PLoS Path 2013 Buffassa et al, PLoS One 2011
Post-treatment controllers had a tougher primary infection than HIV controllers 1200 8 p=0.002 p=0.68 p=0.02 p=0.88 1000 6 800 (log copies/ml) (cells/µl) 4 CD4+ T cells counts at PHI 600 Plasma RNA Viral load at PHI 2 400 0 200 pre-HIC pre-PTC PRIMO Non controllers pre-HIC pre-PTC PRIMO Non controllers Saez-Cirion et al PLoS Path 2013
Post-treatment controllers do not have a favorable MHC background 60 B27 B57 50 B35 B07 40 Allele frequency (%) 30 20 10 0 PTC France HIC Saez-Cirion et al PLoS Path 2013
Efficient T cell responses are associated with natural control 10 4 CD4 T cells CD4:CD8 1:1 10 3 2 10 p24 (ng/ml) 10 1 0 10 10 -1 3 7 10 Days post infection 16000 R=0.836, p<0.00001 14000 12000 10000 8000 IFNg SFC total/106 PBMC 6000 4000 2000 0 0 1 2 3 4 5 Saez-Cirion et al, PNAS 2007; Nature Protocols 2010 log p24 decrease (CD4 vs CD4:CD8 1:1) Saez-Cirion et al, JI 2009 • Greater and faster upregultaionof cytotoxic mediators Migueles, et al. Immunity2008; Hersperger, et al. PLoSPathogens2010
Strong CD8- T cell capacity to suppress HIV-1 is usually absent in PHI 1 1 0.1 0.1 % IL-2+CD4+ T cells % IFNg+CD4+ T cells 5 P < 0.001 0.01 0.01 4 0.001 0.001 3 PHI HIC PHI HIC log p24 decrease (CD4 vs CD4:CD8 1:1) P=0.048 2 10 10 1 1 1 % IFNg+CD8+ T cells % IL-2+CD8+ T cells 0.1 0.1 0 PHI HIC 0.01 0.01 0.001 0.001 PHI HIC PHI HIC 50 patients in PHI (median 35 days p.i.) Lecuroux et al PLoSOne, 2013 Median drop of -0.94 log HIV-1 RNA copies/ml within 7 days
Post-treatment controllers have weak HIV-specific CD8+ T cell responses HIV suppression IFNg ELISPOT <0.01 4 12000 <0.001 <0.01 <0.001 <0.001 10000 <0.001 3 <0.001 8000 log p24 decrease (CD4 vs CD4:CD8) 2 IFNg (SFC/106 PBMC) 6000 4000 1 2000 0 0 PTC VIR HAART HIC PTC VIR HAART HIC Saez-Cirion et al PLoS Path 2013
Post-treatment controllers have weak levels of T cell activation 70 p < 0.001 HAART 60 HIC PTC 50 40 % of CD3+ CD8+ cells 30 p < 0.001 20 10 Saez-Cirion et al PLoS Path 2013 0 CD38+ HLA-DR+ CD38+HLA-DR+
Both HIC and PTC are infectedwith replicationcompetent HIV-1 1000 100 10 p24 in culuresupernatants p24 (ng/ml) 1 0.1 0.01 0 5 10 15 20 25 30 days of culture Viral replicationin CD4+ T cellsfromhealthydonor
A long-termtreatmentinitiatedduringprimary infection seems to increase the chances to control viremia Hocqueloux et al AIDS 2010: N=32 patients, 15.6% VL<50 at M24 Goujard et al AntivirTher 2012: N=164 patients, 8.5% VL<50 at M24 3538 patients included in the FHDH within 6 months of primary infection 1997-2011 756patients treated within 6 months and at least for a year Probability to keepcontrolling infection at 24M (loss of control: 2VL>50 RNA copies/ml or 1VL>50 RNA copies/ml +cART) : 15.7% [6.5-28.5] 74patients with a viral load below <50 RNA copies/ml who stop = 2% of PHI patients Probability to loss control Months post-treatment interruption Saez-Cirion et al PLoS Path 2013
HIC vs PTC Post-Treatment Controllers (PTC) Symptomatic primary infection: high viral loads and low CD4 T cell counts in PHI 57% PTC carry one HLA-class I allele associated with high viral loads Generally very weak HIV-specific T cell responses with poor capacity to eliminate infected cells Low levels of T cell activation Estimated frequency: 5-15% of HIV infected patients interrupting a >12 months-length treatment initiated in primary infection HIV controllers (HIC) Asymptomatic primary infection: low viral loads and high CD4 T cell counts in PHI 80% HIC carry one protective HLA-class I allele Generally strong HIV-specific T cell responses with strong capacity to eliminate infected cells Abnormal high levels of T cell activation Estimated frequency: 0.5% of HIV infected patients
Exploringothermechanismsthat have been proposed to contribute to natural control of infection… Weakcellsusceptibilityto HIV-1 infection, contributingtolimitthereservoirs in HIC Innateimmunity, NK cells, maycontributetolimitreplication in acuteinfection Enhanced ADCC activitymaycontributeto control of infection, in particular in HLA-B*57neg HIC
Acknowledgements Patients and clinicians who participate in the study Institut Pasteur Régulation des Infections Rétrovirales Gianfranco Pancino Daniel Scott-Algara Françoise Barré-Sinoussi Annie David Pierre Versmisse CHU Pitié-Salpetriere INSERM UMR-S 945 Brigitte Autran Charline Bacchus Benjamin Descours Assia Samri Ioannis Theodorou Julien Guergnon CHU Necker Enfants Malades Laboratoire de Virologie Christine Rouzioux Véronique Avettand-Fenoel Adeline Mélard Faculté de Médecine Paris Sud INSERM U1012 Alain Venet Olivier Lambotte Jean-François Delfraissy CécileGoujard IsabelleGirault Camille Lecuroux INSERM U1018 Laurence Meyer FaroudyBoufassa CHR Orléans La Source Service Maladies Infectieuses Laurent Hocqueloux Thierry Prazuck INSERM UPMC U943 Dominique Costagliola Valérie Portard CHU Hôtel-Dieu Unité Immuno-Infectiologie Jean-Paul Viard ANRS CO6 “PRIMO” ANRS CO15 “ALT” FHDH “French Hospital Database on HIV” ANRS CO18 “HIV controllers”