Download
1 / 61
610 likes | 720 Views
PRISM. GROUP. Spatial Climate Datasets and Tools for Improved Agricultural Risk Management in a Changing Climate. David Hannaway Director, Forage Program. Christopher Daly Director, PRISM Climate Group. Oregon State University Corvallis, OR. Topics.

E N D
PRISM GROUP SpatialClimate Datasets and Tools for Improved Agricultural Risk Management in a Changing Climate David Hannaway Director, Forage Program Christopher Daly Director, PRISM Climate Group Oregon State University Corvallis, OR
Topics • The Importance of Climate in Crop Insurance • Climate Mapping with PRISM - overview • PRISM RMA Weather and Climate Portal • How growers and others can contribute to our maps • Crop Suitability Mapping • The 2012 Plant Hardiness Zone Map
Typical Cause-of-Loss Language • “Crop could not be planted due to excessively wet conditions” • “Crop failed due to insufficient moisture” • “Harvest was delayed and crop quality was reduced due to cold and wet weather” • “Crop was damaged due to unusually hot weather” Given a changing climate, how do claims managers evaluate whether an event was unusual?
Answer: Place Weather Events in their Climatological Context Single Year Recent Memory (e.g., last 10 yrs) Daily Monthly Annual Weather Climate Official “Normal” (30 yrs: 1971-2000, 1981-2010…)
Why are the Spatial Aspects of Weather and Climate Important? • The location of interest is often not represented by a nearby weather station • Variations in geographic factors can create large differences in climate or weather over small distances • We need detailed weather and climate maps so that we can see what has been happening on any given field over various times scales
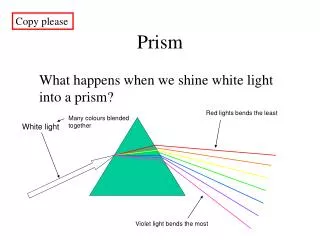
What is Climate Mapping? The process of interpolating climate statistics at irregularly-spaced station locations to a regular grid “Geospatial Climatology” The study of the spatial and temporal patterns of climate on the earth’s surface and their causes
Good Climate Mapping Makes for Good Weather Mapping • Climate provides a long-term context for weather events • Weather is a variation on typical climate conditions • The spatial patterns of long-term climate inform the spatial patterns of weather (“Climate Fingerprint”) 2003 July Tmax (One of Hottest on Record) 1971-2000 July Tmax Different values, but similar spatial pattern
PRISM GROUP • PRISM • Digital Climate Maps • The world’s most advanced climate mapping science • Developed and operated by the PRISM Climate Group, Oregon State University • Official climate maps of the USDA • Funded by NRCS since 1993 and RMA since 2010
PRISM • PRISM spatial climate knowledge base accounts for spatial variations in climate due to: • Elevation – lapse rates • Terrain orientation – rain shadows • Terrain profile – terrain enhancement of precipitation • Moisture regime – exposure to moisture sources • Coastal proximity – marine air intrusion • Two-layer atmosphere – inversion layer, free atmosphere • Topographic position – susceptibility to cold air pooling
Inversions and Agriculture – 1971-00 July Minimum Temperature Northwestern California Pacific Ocean N 48° Willits Ukiah Lake Pilsbury. 50° 63° Ridges: Wine grapes 61° Cloverdale Lakeport 54° Valleys: Tree fruit Clear Lake 63°
Products Guided by PRISM Climatologies Spatial Forecasts National Weather Service Gridded Forecasts
PRISM Datasets are Heavily Used to Guide Spatial Projections of Climate Change PRISM Source: US Global Change Research Program report, 2009
Ground-Breaking Research: Spatial Patterns of Climate Change at the Landscape Scale Projected December Maximum Temperature Change HJ Andrews Experimental Forest, Oregon
CONUS 1895-present Monthly Climate Time Series 116 years of monthly precipitation, min and max temperature, dew point, and vapor pressure
PRISM Support for Crop InsuranceCompliance Provide high-quality weather and climate maps to expedite claims • Did the claimed damaging event occur? • Short time scale: Daily and monthly PRISM maps over the lower 48 states in near real time • Was the event unusual enough to support a loss claim? • Long time scale: Climatic context for the event • Make the assessment process quick and easy • Web-based tools
PRISM/RMA Weather & Climate Portal • New portal being developed for RMA • Provides fast access to quality climate data • Incorporates usability engineering so it’s easier to use and produces info relevant to RMA needs • Initial prototype focuses on 4 key ways users need to find and apply weather&climate data
Classification Scheme – 30 Years Precipitation Temperature Percentile Range Unusually Wet Unusually Warm 90-100th 70-90th Wet Warm 30-70th Typical Typical Cool Dry 10-30th Unusually Dry Unusually Cool 0-10th Rank Rank
Task 3: View Detailed Data • Download data to a spreadsheet
Task 4: Generate Customized Report • Select a 16-month "insurance period" and location • Get an on-demand prevented planting report • Future plans • Other types of reports
Customized Report:Maps of Cumulative Precipitation Compared to Normal 16-month 12-month 6-month 3-month 1-month
Next Steps for Portal • Currently in prototype stage • Open to RMA offices only • Taking feedback from RMA “early adopters” • Plan to open portal to AIP early adopters for review and comment in March 2012 • Long range plan – open up (at least partially) to growers
How Can Growers Participate in the Weather and Climate Assessment Process? • Growers live and breath the weather! • Many take their own precipitation measurements • We cannot accept these measurements because of unknown methods and equipment • But there is now a way for them to participate…
Community Collaborative Rain, Hail & Snow Network Photo: Christy Johnson
CoCoRaHSCitizen observers use simple 4” plastic rain gauges to measure precipitation. The network has suddenly become the nation’s largest source of daily precipitation measurements (15,000+ observers)Data are QC’ed every day and incorporated into PRISM weather and climate datasets
Rainfall Hail Snowfall
Getting Started • Anyone can join CoCoRaHS • Buy a <$30 rain gauge • We encourage growers to participate, and contribute data from their farms! • To get started, go to http://cocorahs.org
PRISM Support for Crop Insurance Underwriting:Crop Suitability Maps • Develop suitability maps based on climate and soils • Relative yield potential (0-100%) based on climate and soil conditions • Provide a climatic “reality check” for yield guarantees (currently based on grower’s reported yield history) • Should a current crop be insured, or is too risky? • Where can a new biofuel feedstock be grown successfully?
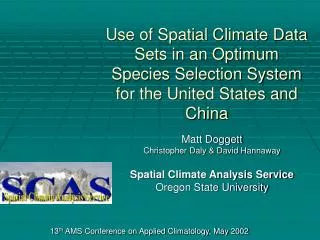
Origins of our Suitability Mapping Approach • Goal: Improve the marketing of US-grown grass seeds in China by developing better tools for selecting optimal species and varieties for forage, soil conservation, and amenity grasses. Project performed between 1998 and 2005 China: Market Opportunities for U.S.-Grown Cool Season Grasses and Legumes
Project Rationale • China is growing rapidly, and demands have greatly expanded for: • Improved forage-livestock systems • urban beautification • improved environmental protection • Result is increased market demands for high quality grass seeds • Effective marketing of our high quality US-grown seeds requires that we be able to identify all of the areas suitable for using these grasses • Until now that has been impossible on a wide scale. Field-based trials are not effectively extrapolated to other locations. • Current computer technology makes it possible to create detailed maps of climate and soils and combine them with species tolerances to accurately identify suitable growing areas for effective marketing
Traditional Method:Field-based evaluation trials • Expensive • Time Consuming • Unpredictable • Cooperators Hard to Find • Management Issues
ClimateStation Data: 1961-90 mean monthly max/min temperature, precipitation 2,600 stations
Species July Max. Temp (°C) Jan Min. Temp (°C) Annual Precipitation (mm) Well Suited Tall Fescue 22 - 32 -10 625 Orchardgrass 22 - 31 -7.5 625 Perennial Ryegrass 22 - 30 -5 625 Moderately Suited Tall Fescue 20 - 34 -15 450 Orchardgrass 20 - 33 -12.5 490 Perennial Ryegrass 20 - 32 -10 525 Marginally Suited Tall Fescue 18 - 36 -20 300 Orchardgrass 18 – 35 -17.5 375 Perennial Ryegrass 18 - 34 -15 450 Identify Quantitative Climate Tolerances in US Where Ranges are Better Known
Tall Fescue Suitability All Climate & Soil Constraints
Tall Fescue Suitability No Soil Constraints (Climate Only)
Tall Fescue Suitability No Precip Constraint (Irrigated)
Tall Fescue Suitability No Soils, Irrigated, No Overwintering (Annual)
Tall Fescue Suitability Map: China Transfer Tolerance Table from US to China
Benefits • Suitability maps provided an early estimate of grower success throughout the country • Suitability maps allowed marketing efforts to target the best suited regions of China • Grass seed exports to China increased dramatically in years following the study
Temp Suitability Mapping Applied to Crop Insurance Precip ETa China Model Updated and Improved Semi-Monthly Water Balance Simulation KS Kc Es [AWC] TAW Droot Dr ------------------------- Deep Soil Em
Nationwide Crop Suitability Mapping Dryland Winter Wheat Draft Support: DOE Sun Grant, RMA All Land Non-Forest Land Assumes Amended Soils - Liming (pH) and Tiling (Drainage)
Nationwide Crop Suitability Mapping Dryland Sorghum Draft Support: DOE Sun Grant, RMA All Land Non-Forest Land Assumes Amended Soils - Liming (pH) and Tiling (Drainage)