Download
1 / 57
570 likes | 577 Views
Inland Empire Economic Growth . . . Building An Expansion. John Husing, Ph.D. Economics & Politics, Inc. Chief Economist, IEEP. After Losing 8.71 Million Jobs … U.S. Jobs All The Way Back & More. Petroleum Prices. Value of the Dollar. Consumer Confidence, 2009-2015.

E N D
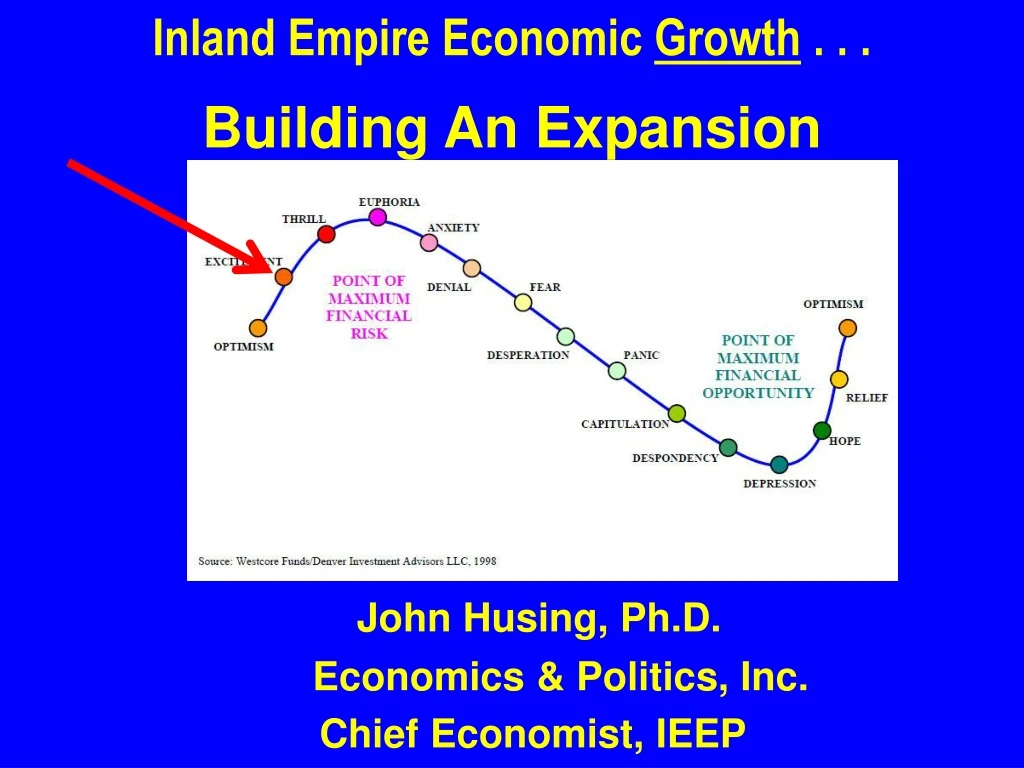
Inland Empire Economic Growth . . . Building An Expansion John Husing, Ph.D. Economics & Politics, Inc. Chief Economist, IEEP
After Losing 8.71 Million Jobs …U.S. Jobs All The Way Back & More
U.S. & CA Unemployment History 6.9% 5.6% Great Recession
California Job Gains/Losses 2008-2010 -1,066,400 2011-2014 +1,301,708 2014 Up +401,217 37.8% Up Recovery Great Recession
Where Is the IE In Its Job History? 2011-2014 139,767 of 142,933 lost or 98.8% 3,167 Jobs To Go
How Regional Economies Work Secondary Tier Economic Development … Increase The Economic Base! Primary Tier
Home Price Trends 2014, 71.0% 38.4% Above Existing Home -31.0%
Affordability to Median Income Household I. Empire L.A./SD Orange.
Mortgage Credit Still Tight • Percentage of closed loans with an average FICO score below 700 dropped: • 30 percent in January 2015 • 32 percent in January 2014 • Average FICO all loans was 731 up 5% from the 2014 average
The Future: Survey of 1,600 Millennials • 66% want to live in the suburbs • 24% want to live in rural areas • 10% want to live in a city center • Want to live in more space than they have now • 81% want three or more bedrooms in their home
Why Low Volume • Less Foreclosures • Buyers Want or Need High Prices • Credit Hurt By Foreclosures • High FICO Scores • FHA Lowering Conforming Mortgage Ceiling From $500,000 to $350,000 • Millennials Not Forming Families • Fear • Coming Help • FHA Lowering PMI rate on conforming loans 1.35% to 0.85% • Interest Rates Remaining Low • FNMA & Freddie Mac Easing Mortgage Requirements
Construction Job Growth! Median Pay $51,923
Why Home Construction’s Return Is Important Jobs Lost 2007-2011: -67,783 Job Gain 2012-2014: 17,892 Job Deficit: -49,892
Port Container VolumesStrike Impact -26.1% -21.6%
Logistics Job Growth & Why It Is Important 19.3% of New Inland Jobs in 2013 20.0% of New Inland Jobs in 2014 Median Pay $43,911
Manufacturing Some Recovery Median Pay $49,138
Nestle to close Valley food Plant 360 California jobs will be lost as Hot Pockets production goes to Kentucky BUSINESS Thursday, August 7, 2014 LATIMES.COM/BUSINESS :: “In higher skilled industries they are hesitant to move because the labor force is not available anywhere. But lower-skilled one, they have an easier time leaving. That trend in California has the potential to leave lower-educated workers behind.
Beware • EPA-CARB-AQMD Standards Eliminating Ability of Blue Collar Sectors to Grow: • Manufacturing (Not Growing) • Logistics (Prime New Target) • Construction (NIMBY’s Love CEQA) • Blue Collar Sector Growth Needed To Allow Marginally Educated To Access the Middle Class • Poverty is Exacerbated as a Result!
EPA & CARB SPONSORED 2015 SCIENTIFIC REPORT . . . • TRUCKS NO LONGER A MAJOR PUBLIC HEALTH THREAT! • 2007 Truck Engines: No Lifetime Cancer Risk • 2007 Truck Engines: 90% End To NO2 & PM2.5 Emissions • 2010 Engines: NO2 & PM2.5 “Substantially” Cut Further
Higher End Homes UPLAND $484,914 $465,778 Claremont $568,700 $427,095 $585,199 EASTVALE $468,269 $459,000 CORONA $429,667 TEMECULA $344,095 $393,603
Office Absorption Follows Higher-End Workers High-End Jobs Follow Workers into the Area
Office Vacancy Rates Improving But Still Very High 24.0% 17.0%