Download
1 / 55
550 likes | 553 Views
Learn about the spectral performance metrics for dynamic converters, including SNR, SNDR, ENOB, DR, SFDR, THD, ERBW, IMD, and MTPR. Explore concepts like DFT, windowing, and quantization noise in the frequency domain.

E N D
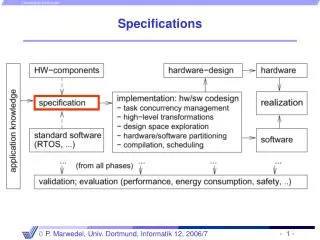
Dynamic Specifications • Spectral performance metrics follow from looking at converter or building block output spectrum • Basic idea: • Apply one or more tones at converter input • Expect same tone(s) at output, all other frequency components represent non-idealities • Important to realize that both static and dynamic errors contribute to frequency domain non-ideality • Static: DNL,INL • Dynamic: glitch impulse, aperture uncertainty, settling time, … Metric: a standard for measuring or evaluating somethings. Glitch:جریان قوی و غیرعادی برق Aperture: روزنه Uncertainty: عدم قطعیت
Cont’d Glitch
Cont’d Jitter: irregular random movement, لرزه
Spectral Metrics • SNR - Signal-to-noise ratio • SNDR (SINAD) - Signal-to-(noise + distortion) ratio • ENOB - Effective number of bits • DR - Dynamic range • SFDR - Spurious free dynamic range • THD - Total harmonic distortion • ERBW - Effective Resolution Bandwidth • IMD - Intermodulation distortion • MTPR - Multi-tone power ratio
Discrete Fourier Transform Basics • DFT takes a block of N time domain samples (spaced Ts=1/fs) and yields a set of N frequency bins • Bin k represents frequency content at k·fs/N [Hz] • DFT frequency resolution • Proportional to 1/(N·Ts) in [Hz/bin] • N·Ts is total time spent gathering samples • A DFT with N=2integer can be found using a computationally efficient algorithm • FFT = Fast Fourier Transform Yield: نتیجه دادن Bin: سطل
MATLAB Example clear; N = 100; fs = 1000; fx = 100; x = cos(2*pi*fx/fs*[0:N-1]); s = abs(fft(x)); plot(s 'linewidth' 2);
Normalized Plot with Frequency Axis N = 100; fs = 1000; fx = 100; % full-scale amplitude x = FS*cos(2*pi*fx/fs*[0:N-1]); s = abs(fft(x)); % remove redundant half of spectrum s = s(1:end/2); % normalize magnitudes to dBFS -200 % dbFS = dB relative to full-scale s = 20*log10(2*s/N/FS); % frequency vector f = [0:N/2 1]/N; plot(f, s, 'linewidth', 2); xlabel('Frequency [f/fs]') ylabel('DFT Magnitude [dBFS]')
Another Example • Same as before, but now fx=101 • This doesn't look the spectrum of a sinusoid… • What's going on? • Spectral leakage is occurred.
Utilizing Appropriate Signal Frequency N = 100; k = 9; fs = 1000; fx = k*fs/N; • Usable test frequencies are limited to a multiple of fs/N. • If we choose fx as follows, then a good spectrum is obtained. • fx=(k/N)fs; k: integer
Windowing • Spectral leakage can be attenuated by windowing the time samples prior to the DFT • Windows taper smoothly down to zero at the beginning and the end of the observation window • Time domain samples are multiplied by window coefficients on a sample-by-sample basis • Means convolution in frequency • Sine wave tone and other spectral components smear out over several bins • Lots of window functions to chose from • Tradeoff: attenuation versus smearing • Example: Hann Window taper: باریک شدن smear: پخش شدن
Hann Window N=64; wvtool(hann(N))
Spectrum with Window N = 100; fs = 1000; fx = 101; A = 1; x = A*cos(2*pi*fx/fs*[0:N-1]); s = abs(fft(x)); x1 = x *hann(N); s1 = abs(fft(x1));
Utilizing Appropriate Signal Frequency versus Windowing • Utilizing Appropriate Signal Frequency • Test signal falls into single DFT bin • Requires careful choice of signal frequency • Ideal for simulations • In lab measurements, can lock sampling and signal frequency generators (PLL) • "Coherent sampling" • Windowing • No restrictions on signal frequency • Signal and harmonics distributed over several DFT bins • Beware of smeared out non-idealities… • Requires more samples for given accuracy • More info • https://www.maximintegrated.com/en/app-notes/index.mvp/id/1040
Example • Now that we've "calibrated" our test system, let's look at some spectra that involve non-idealities • First look at quantization noise introduced by an ideal quantizer N = 2048; k= 67; fs = 1000; fx = fs*k/N; LSB = 2/2^10; %generate signal, quantize (mid-tread) and take FFT x = cos(2*pi*fx/fs*[0:N-1]); x = round(x/LSB)*LSB; s = abs(fft(x)); s = s(1:end/2)/N*2; % calculate SNR sigbin = 1 + k; noise = [s(1:sigbin-1), s(sigbin+1:end)]; snr = 10*log10( s(sigbin)^2/sum(noise.^2) );
Spectrum with Quantization Noise • Spectrum looks fairly uniform • Signal-to-quantization noise ratio is given by power in signal bin, divided by sum of all noise bins
FFT Noise Floor • Depends on FFT size • Plot is “useless” if FFT size is not specified
Periodic Quantization Noise • Same as before, but k = 64 (instead of 67) • fx = fs.64/2048 = fs/32 • Quantization noise is highly deterministic and periodic • For more random and "white" quantization noise, it is best to make N and k mutually prime • GCD(N, k)=1 Mutually: متقابل
Typical ADC Output Spectrum • Fairly uniform noise floor due to additional electronic noise • Harmonics due to nonlinearities • Definition of SNR • Total noise power includes all bins except DC, signal, and 2nd through 7th harmonic • Both quantization noise and electronic noise affect SNR
SNDR and ENOB • Definition • Noise and distortion power includes all bins except DC and signal • Effective number of bits
Effective Number of Bits • Is a 10-Bit converter with 47.5dB SNDR really a 10-bit converter? • We get ideal ENOB only for zero electronic noise, perfect transfer function with zero INL, ... • Low electronic noise is costly • Cutting thermal noise down by 2x, can cost 4x in power dissipation • Rule of thumb for good power efficiency: ENOB < B-1 • B is the "number of wires" coming out of the ADC or the so called "stated resolution" cut down: reduce so called: مصطلح
SFDR • Definition of "Spurious Free Dynamic Range“ • Largest spur is often (but not necessarily) a harmonic of the input tone spur Spur (مهمیز) Spur:سیخ-مهمیز Spurious:جعلی-غیرقانونی
SDR and THD • Signal-to-distortion ratio • Total harmonic distortion • By convention, total distortion power consists of 2nd through 7th harmonic • Is there a 6th and 7th harmonic in the plot to the right? By Convention: معمولا
Lowering the Noise Floor • Increasing the FFT size let's us lower the noise floor and reveal low level harmonics
Aliasing • Harmonics can appear at other frequencies due to aliasing
Intermodulation Distortion • IMD is important in multi-channel communication systems • Third order products are generally difficult to filter out
MTPR • Useful metric in multi-tone transmission systems • E.g. OFDM
Frequency Dependence (1) • All of the above discussed metrics generally depend on frequency • Sampling frequency and input frequency
ERBW • Defined as the input frequency at which the SNDR of a converter has dropped by 3dB • Equivalent to a 0.5-bit loss in ENOB • ERBW > fs/2 is not uncommon, especially in converters designed for sub-sampling applications
Relationship Between INL and SFDR • At low input frequencies, finite SFDR is mostly due to INL • Quadratic/cubic bow gives rise to second/third order harmonic • Rule of thumb: SFDR ≈ 20log(2B/INL) • E.g. 1 LSB INL, 10 bits SFDR ≈ 60dB • E.g. 0.25 LSB INL, 10 bits SFDR ≈ 72dB bow : انحنا
Topics • Now what? • Practical aspects of converter testing • Equipment requirements • Pitfalls Pitfall: چاله اشکال غیر منتظره
ADC Test Setup Acquisition: به دست آوری- اکتساب Across: از یک زمان به زمان دیگر
High-Performance ADC Specs • Testing a high performance converter may be just as challenging as designing it! • Key to success is to be aware of test setup and equipment limitations
Signal Source • Want: SFDR>85dB @ fin=fs/2=37.5MHz • Let's see, how about the "value priced" signal generator we have in the lab... • f=0...15MHz • Harmonic distortion (f>1MHz): -35dBc • Need something better... value priced: مقرون به صرفه
A Better Signal Source • OK, now we've spent about $40k, this should work now... (?) • f=100kHz...3GHz • Harmonic distortion (f>1MHz): -30dBc ! • No way to produce the sine wave we need without a filter!
Filtering Out Harmonics • Given HD=-30dBc, we need a stop-band rejection > 60dB to get SFDR>90dB
Available Filters • Want to test at many frequencies -> Need to have many different filters!
Tunable Filter • Want to test at many frequencies -> Need to have many different filters!
Filter Distortion • Beware: The filters themselves also introduce distortion • Distortion is usually not specified, need to call manufacturer • Often guaranteed: HD<-85dBc, • Don't trust your filters blindly...
Clock Generator • OK, may be for the clock a "value-priced" signal generator will suffice... • No! The clock signal controls sampling instants – which we assumed to be precisely equidistant in time (period T) • See Lecture for a discussion of aperture uncertainty • Typically use sine wave and "square up" with inverter chain • Jitter requirements sine wave specs
Phase Noise and Jitter • Can use the above equation to get a (very rough) jitter estimate from phase noise spectrum • "Value Priced" Signal Generator: • L(30kHz)=-55dBc/Hz -> (fo=15MHz)= 918ns rms • "$40k" Signal Generator: • L(30kHz)=-122dBc/Hz -> (fo=15MHz)= 0.41ns rms OK!
Jitter Induced noise • The SNR related to the jitter induced noise is as follows:
Example • In the following structure, How much jitter is allowed for the clock generator so that the performance of the system is not affected.