Download
1 / 15
150 likes | 403 Views
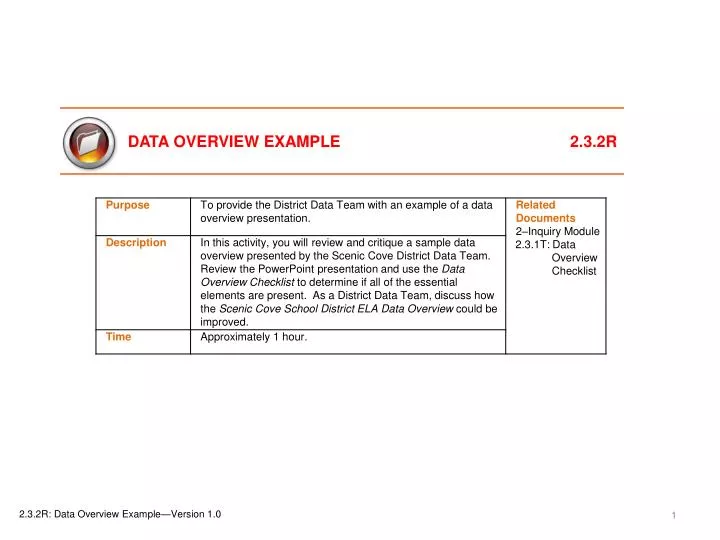
2.3.2R: Data Overview Example—Version 1.0. Scenic Cove School District. Data Overview Presentation, September 2009 Presented by the District Data Team. 2.3.2R: Data Overview Example—Version 1.0. Agenda. Purpose of this presentation Presentation of relevant data displays

E N D
Scenic Cove School District Data Overview Presentation, September 2009 Presented by the District Data Team 2.3.2R: Data Overview Example—Version 1.0
Agenda • Purpose of this presentation • Presentation of relevant data displays • Collaboratively brainstorm to: • Identify and prioritize a problem evident in the data • Formulate hypotheses to explain the problem • Generate clarifying questions to direct further inquiry • Identify additional data needed and potential data sources • Discuss next steps 2.3.2R: Data Overview Example—Version 1.0
The Issues • The academic performance of English language learners (ELLs) in the Scenic Cove School District is lower than the statewide population of ELLs at several grade levels on 2009 MCAS English Language Arts (ELA) tests. • The academic performance of ELLs in the district lags behind their native English-speaking peers. • The academic performance of ELLs in the district falls below established NCLB performance and improvement targets. 2.3.2R: Data Overview Example—Version 1.0
Purpose To begin the process of collaborative inquiry that will address the focusing questions: • What does the performance of ELLs in the district look like over time on MCAS ELA tests? • How does the performance of ELLs in the district compare to that of ELLs state-wide on the 2009 MCAS ELA test? • Why is the performance of ELLs in some grades closer to the state average than others on the 2009 MCAS ELA test? • What is the performance of ELLs in targeted grades in district schools on the 2009 MCAS ELA test? • How does the performance of ELLs in the district compare to the state on the 2009 MEPA test? 2.3.2R: Data Overview Example—Version 1.0
What does the performance of ELLs in the district looklike over time on MCAS ELA tests? Source: Data Warehouse > Public Folders > ESE Cubes > MCAS Official Release 2009 6 2.3.2R: Data Overview Example—Version 1.0
How does the performance of ELLs in the district compare to that of ELLs state-wide on the 2009 MCAS ELA test? Source: Data Warehouse > Public Folders > ESE Cubes > MCAS Official Release 2009 7 2.3.2R: Data Overview Example—Version 1.0
Why is the performance of ELLs in some grades closer to the state average than others on the 2009 MCAS ELA test? Source: Data Warehouse > Public Folders > ESE Cubes > MCAS Official Release 2009 8 2.3.2R: Data Overview Example—Version 1.0
What is the performance of ELLs in targeted grades indistrict schools on the 2009 MCAS ELA test?* *Minimum 10 Students Source: Data Warehouse > Public Folders > ESE Cubes > MCAS Official Release 2009 9 2.3.2R: Data Overview Example—Version 1.0
What is the performance of ELLs in targeted grades indistrict schools on the 2009 MCAS ELA test?* *Minimum 10 Students Source: Data Warehouse > Public Folders > ESE Cubes > MCAS Official Release 2009 10 2.3.2R: Data Overview Example—Version 1.0
What is the performance of ELLs in targeted grades indistrict schools on the 2009 MCAS ELA test?* *Minimum 10 Students Source: Data Warehouse > Public Folders > ESE Cubes > MCAS Official Release 2009 11 2.3.2R: Data Overview Example—Version 1.0
Spring 2009 MEPA Results: Percentage of Students at Each Performance Level by Years of Enrollment in the State and Scenic Cove Source: Massachusetts English Proficiency Assessment (MEPA) Statewide Results: Spring 2009; Spring 2009 MEPA Results by District http://www.doe.mass.edu/mcas/mepa/results.html 2.3.2R: Data Overview Example—Version 1.0
Brainstorm Groups 2.3.2R: Data Overview Example—Version 1.0
Brainstorm! 2.3.2R: Data Overview Example—Version 1.0
Next Steps • What additional data do we need to collect? • Who will collect the data? • How will the data be collected? • When will we have collected the data? • Who will analyze the data? • What materials should we have for the next meeting? • Next meeting date and time? 2.3.2R: Data Overview Example—Version 1.0