Download
1 / 21
210 likes | 324 Views
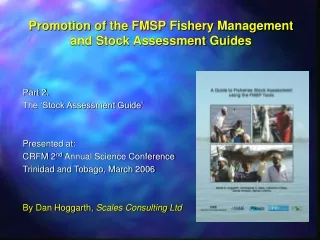
Fishery Assessment of Sardine Stock GSA06 (Northern Spain). Bellido, J.M. 1 , Quintanilla, L. 2 , Giráldez, A. 2 , Torres, P 2 ., Ceruso, C. 1 , Alemany, F. 3 , Iglesias, M. 3

E N D
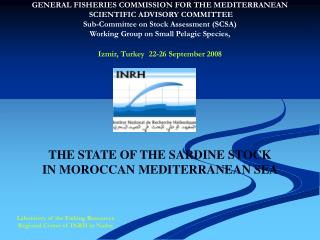
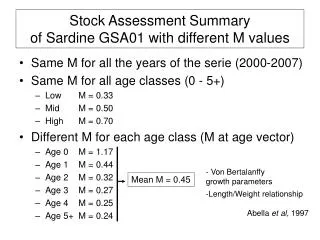
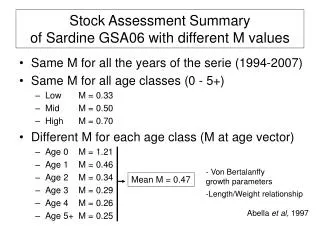
Fishery Assessment of Sardine Stock GSA06 (Northern Spain) Bellido, J.M.1, Quintanilla, L.2, Giráldez, A.2, Torres, P2., Ceruso, C.1, Alemany, F.3, Iglesias, M.3 1 Instituto Español de Oceanografía. Centro Oceanográfico de Murcia. C/ Varadero 1. San Pedro del Pinatar. 30740. Murcia. Spain. 2 Instituto Español de Oceanografía. Centro Oceanográfico de Málaga. Puerto Pesquero s/n. Apdo 285. Fuengirola. 29640. Málaga. Spain. 3 Instituto Español de Oceanografía. Centro Oceanográfico de Baleares. Muelle del Poniente s/n. Apdo 291. Palma de Mallorca 07015. Spain. Sardine GSA06 Bellido et al
Introduction • Fishery assessment by VPA methods of the Spanish sardine stock GSA06 is reported. • VPA Lowestoft software suite was used and XSA was the assessment method. A separable VPA was also run as exploratory analysis for both stocks. • Stochastic short term projections were also produced. Sardine GSA06 Bellido et al
GFCM GSA- 06 Northern Spain Landings and samplingports (in blue) Sardine GSA06 Bellido et al
Assessment Data GSA06 • Landings time series 1994-2007. • ALK 2004-2006, combined ALK for 1994-2003. Length Distributions 1994-2007. • Biological sampling 2004-2007 for Maturity at age and Weight-Length relationships. • Tuning data from acoustic survey ECOMED and Commercial Fleet off Barcelona, Tarragona, Castellón and Torrevieja. Sardine GSA06 Bellido et al
XSA Input Data GSA06 Sardine GSA06 Bellido et al
XSA Input Data GSA06 Sardine GSA06 Bellido et al
Assessment Model • Separable VPA – as Exploratory tool. • VPA - XSA (Extended Survivors Analysis) as assessment tool. Sardine GSA06 Bellido et al
Diagnostics Separable GSA06 Log catchability residual plots. No unusual pattern of residuals and conflicts between ages. Sardine GSA06 Bellido et al
XSA Assessment • Main Settings XSA: • Fbar 1-3. • Age 2 for q stock-size independent and age 3 for q independent of age. • Fshrinkage = 0.500 and S.E. for fleet terminal estimates ≥ 0.300 • XSA Diagnostics. • Residuals by Fleet. • Estimations of Survivors by age and fleet. Sardine GSA06 Bellido et al
Fleet Diagnostics GSA06 Sardine GSA06 Bellido et al
Estimated Survivors by Fleet GSA06 Sardine GSA06 Bellido et al
Estimated Survivors by Fleet GSA06 Sardine GSA06 Bellido et al
Estimated Survivors by Fleet GSA06 Sardine GSA06 Bellido et al
Stock Summary GSA06 Sardine GSA06 Bellido et al
Short term projections • Deterministic Projections for three years (2008 to 2010). • MFDP software (Multi-Fleet Deterministic Projections). Settings: • Recruitment Geometric mean: • GSA06 - RGM1997-2006 = 1603 millions. • F statu quo is Fishing Mortality Average last three years and Reference ages 1-3, i.e. average Fbar last 3 years. • GSA06 - Fstatu quo = 0.80. Sardine GSA06 Bellido et al
Results GSA06 Short term projection Sardine GSA06 Bellido et al
Conclusions - Assessment • Landings in 2007 were 23,980 t, showing a decrease from that of 2006 (29,350 t). The time series shows an stable pattern, although it is at low level. The lowest landings of the assessed time series is 2002. • Fishing mortality is at a moderate-high level (F07=0.83), showing a rather plane pattern from 2002 onwards. • Recruitment in 2007 (R07=1478 millions) increases slightly from that of 2006 (1172 millions). The trend of the recruitments is so important as they can affect seriously to the stock health. • Both Total Biomass in 2007 (TB=72,860 t) and Spawning Stock Biomass in 2006 (SSB=51,220 t) show an stable pattern with a slight recovery from the lowest observed SSB (Bloss=36,830 t, in 2002), although both TB and SSB are still at a rather low level. Sardine GSA06 Bellido et al
Conclusions - Catch forecasting • statu quo F (Fbar05-07=0.80, RGM1997-2006 = 1603 millions) • landings are predicted to be close to 23,200 t in 2008 and 25,300 t in 2009. • Total biomass will be 74,000 t in 2008, 78,300 t in 2009 and 80,100 t in 2010, what account for an increase on stock numbers. • SSB will also increase from 50,800 t to 56,500 t from 2008 to 2010. • This exploitation pattern to maintain F statu quo 2007-09 will produce a slightly gain and continuing the increasing trend, helping the recovery of the stock from its lowest value in 2002. Sardine GSA06 Bellido et al
Conclusions - Management considerations • No reference points for sardine can be suggested at this point. Further research is aimed to produce Reference Points and Harvest Control Rules for the sardine GSA06 fishery. • This fishery is considered as fully exploited. • We consider fishing effort should not increase beyond the current levels. This should allow to maintain the current levels of Fishing mortality. Sardine GSA06 Bellido et al
Further work • Reference points • Harvest Control Rules. Sardine GSA06 Bellido et al
Thanks for your attention. Comments are welcomed. Dr. Jose Mª Bellido (josem.bellido@mu.ieo.es) Sardine GSA06 Bellido et al