Download
1 / 41
410 likes | 572 Views
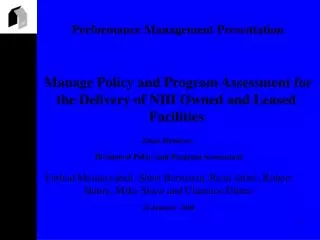
Performance Management Presentation. Manage Policy and Program Assessment for the Delivery of NIH Owned and Leased Facilities. Team Members : Division of Policy and Program Assessment Farhad Memarzadeh, Sheri Bernstein, Reza Jafari, Robert Henry, Mike Shaw & Clarence Dukes 14 January 2005.

E N D
Performance Management Presentation Manage Policy and Program Assessment for the Delivery of NIH Owned and Leased Facilities Team Members: Division of Policy and Program Assessment Farhad Memarzadeh, Sheri Bernstein, Reza Jafari, Robert Henry, Mike Shaw & Clarence Dukes 14 January 2005
Overview and Contents • Background on DPPA • Our Mission? • What Services We Provide? • Who Do We Serve? • Who Are Our Stakeholders? • What Is Critical for Our Success? • What We Have Learned? • What Our Customers Think About the Services We Provide? • Our Next Steps?
Background on DPPA • Resulted from 2002 re-alignment of the Office of Research Services. • In operations > 2 years. • Consist of Policy and Quality Assessment Branches. • Strive to provide tools to streamline and improve delivery of NIH real property. • FY04 is the Baseline Assessment Year for measuring performance.
Our Mission To responsibly execute the public trust by management and development of policies and procedures to help achieve the best value and quality at all levels of project design, construction, commissioning and operations within the Office of Research Facilities (ORF)
What Services We Provide?(DS = Discrete Services) • DS # 1: Provide policies, standards & guidelines for NIH owned & leased facilities. • DS # 2: Ensure ORF operations conform to applicable regulations, codes, standards and guidelines. • DS # 3: Develop suitable performance management methods to evaluate, improve and enhance delivery of facilities. • DS # 4: Coordinate training to maintain technical excellence and support effective implementation of policies and procedures. • DS # 5: Prepare the facilities section of the NIH Government Performance and Results Act (GPRA) Plan.
Our Customers Project Officers Program Managers Facility Managers Branch Managers Division Heads Our Stakeholders Architects-Engineers National Center for Research Resources Colleges, universities, state & local governments involved with the design & construction of facilities using grant funds Who Do We Serve?
What Is Critical for Our Success(FY04 Objectives) • Adopted a Strategy Mapping Approach • Focused on activities that directly contribute to successful accomplishment of long term objectives. • Those that benefit 1st Line customers (Program Managers & Project Officers). • Be consistent with the Performance Management Plan (PMP) methodology • Evaluate & Assess Critical Performance Measures linked to the Customer, Internal Business, Learning & Growth & Financial Perspectives that are part of the balanced scoreboard. • FY 04 is the baseline year for analysis of our performance. • Focus on determining how well services are being delivered in providing the expertise, practices, tools and guidance to help Project Officers monitor & measure project status.
What Is Critical for Our Success(FY04 Critical Measures) • From the Customers Perspective • % Project Review Board (PRB) reviews that meet due dates • # Customers attending training • From an Internal Business Process Perspective • # Qualified Projects using Earned Value Analysis (EVA) • From a Learning and Growth Perspective • Training hours related to EVM and related professional development • From a Financial Perspective • Unit cost of Discrete Services
Objective C2. Improve availability and reliability of guidance and expertiseMeasure: C2.a.% PRB’s Reviews that meet due dates Percent Month
Objective C3. Our customers are familiar with the Guidelines Measure:C3.a. % Scheduled customers attending training • Design Policy & Guidelines (DPG) training was only offered in the 2nd Qtr of FY04 • 172 people attended, this included: • ORF participants • ICD participants • Architect-Engineering Firms • Approximately 85% of ORF has received DPG training
Lessons-learned from Customer data? • Data Analysis indicated: • Our Customer Base must be verified. • Customer Surveys must be analyzed when a minimum response rate of 25% is received. • Use of Customer Surveys must be expanded. • Training in the PMP will benefit customers/clients for a full understanding of the linkage between: • The NIH Strategic Plan • DHHS Goals & Objectives • OMB & the presidents Management Objectives
Actions taken Based on Customer data? • Data Analysis indicated several possible conditions: • Additional Customer Surveys have been developed & distributed. • Customer Surveys have been tailored to fit the requirement. • Training to address core business practices is being discussed. • Looking at the use of Focus Groups for feedback. • We are re-evaluating our Customer & Stakeholder base.
Objective: IB1. Improve thoroughness, reliability & accuracy of policies, guidelines, standards & procedures Measure: IB1.e # of Project Reviews completed on schedule Number of Projects FY04 Quarter
Objective: IB2. Improve Best Value Analysis Measure: IB2.a # of Qualified projects using EVA Number of Projects FY04 Quarter
NCRR Technical Grant Review (Workload Summary) • 151 Submittals received for review • Workload Reflects • 25 Colleges & Universities • 8 Institutions • 1 Historically Black College/University • 66 – Final Contract Documents approved • 70 – Active Grants & end of FY04 # of Projects FY04 Quarter
Lessons-learn from Internal Business Process (IBP) data? • Ourautomated management system must be modified to provide user friendly reports on project reviews. • Additional EVMS training is required. • Need to improve the EVMS contract clause & enforcement for performance of EVMS. • Additional Resources are required to handle the PRB workload. • Databases Used for project reporting must be fully populated to permit accurate assessment of performance & accomplishments. • Monthly management reports are essential to our success. • Our Grant Program workload must be highlighted. • Time required for project reviews must be re-evaluated.
Actions taken Based on IBP data? • More analysis of our project review process would be beneficial. • Additional training in our core business practices is being facilitated to assure they are fully understood to facilitate adopting a a day to ay practice. • Recommending use of team building for program performance enhancements. This could be a cross-organization initiative. • Facilitating including additional management tools for project reporting • Educate the NIH Community & staff on services provided & how they enhance performance and delivery of facilities. • Standardize business practices to help ensure continuous delivery of quality products, services and facilities.
Objective L1. Be experts in best practices for project analysis and quality assurance Measure L1.a: Customer Survey FY04 Quarter
Objective L1. Be experts in best practices for project analysis and quality assurance Measure L1.b: Training hours for assessment and interpretation of EVM and related professional development courses FY04 Quarter
Earned Value Training Survey Summary • Number of Students 30 • Number Man-hours 240 • Student Breakdown • Program Managers 5 • Project Officers 10 • Contracting Officer 2 • Contract Specialist 1 • Contractor 1 • Number of Respondents 19 • Response Rate 63 % • Maximum Possible Score 10 • Average Score 7.93
Earned Value Training SummaryHow would you rate the following?( 1= Unsatisfactory to 10 = Outstanding )
Earned Value Training SummaryInstructor and Training Material Rating ( 1= Unsatisfactory to 10 = Outstanding )
Earned Value Training Conclusions From Findings • Satisfaction was highest with: • The Instructor as a subject matter expert. • Quality of Training Materials • Answered my questions regarding what earned value is. • Answered my questions regarding benefits of earned value • Answered my questions regarding what are earned value indices and triggers that let you know you have a problem • Satisfaction was lowest with: • Answered my questions regarding difference between earned value and other project management processes • Answered my questions regarding whether earned value can be used for various contract acquisition types • Answered my questions regarding why earned value is needed • Comments indicate: • Course length must be re-evaluated. • Colors used in training material to be re-evaluated. • Contractors must be brought up to speed on EVMS requirements.
How would you rate the following?( 1= Poor to 5 = Excellent ) Pre-project Planning
Pre-Project Planning Training Survey Summary • January 12-13, 2004 – Atlanta • # Surveys Distributed 31 • # Respondents 23 • Response Rate 74% • February 3-4, 2004 – Rockville • # Surveys Distributed 35 • # Respondents 28 • Response Rate 80% • February 17-18, 2004 – Bethesda • # Surveys Distributed 35 • # Respondents 26 • Response Rate 74%
Redi-Check Training & Survey Summary • No. of Students 36 • Student Breakdown • Program Managers 5 • Project Officers 10 • Contracting Officer 2 • Others 4 • # of Respondents 18 • Response Rate 50 % • Maximum Score 10 • Average Score 8.95
Lessons-learned from Internal Learning & Growth (L&G) data? • Education of the PMP Process and its relationship to Individual Development or Performance Plans (IDP) is essential. • IDP are recommended for all that are linked to the PMP and other management objectives based on the position. • Budgeting for training should be linked to IDPs.
Actions taken Based on L&G data? • Training required in the following areas: • EVMS • PDRI • Design-Build • Appropriation Law • Cost Estimating • Team Building • Project Risk Management • An Organization Training Development Plan should be developed as employee orientation guide & expand for ORF).
Objective F1. Minimize unit costsMeasure F1.1 Comparison Year to Year Discrete Service Costs
Lessons-learned from Financial data? • Our Timecard Module must be expanded to capture reports needed for fiscal management. • Cost reporting must be enhanced to capture all cost associated with the services provided. • Resources allocation should be re-analyzed after the ORF realignment is completed. • Actual to budget comparisons should be fully supported to enhance planning for the future. • Monthly management reports should be generated to evaluate how resources are being utilized.
Actions taken Based on Financial data? • Validating cost of Discrete Services. • Facilitating additional management reports. • Resources can be shared based on data from monthly workload summaries. • Discussing budget formulation and issues. • Starting cost trending analyses.
Need to continue analysis of how we use/allocate professional resources in performing our Discrete Services. Key FY 05 Initiatives: Training Policy Development Design-Build Portfolio Management Pre-Project Planning (PDRI) Post Occupancy Evaluation Design Policy & Guidelines Building Occupancy EVMS Security Permitting Process Other Actions Quality System Manual Develop New Employees orientation plan New A/E Selection Form Develop employee training plan Appropriation Law Enhance Quality Assessment of facilities Conclusions