Download
1 / 21
210 likes | 336 Views
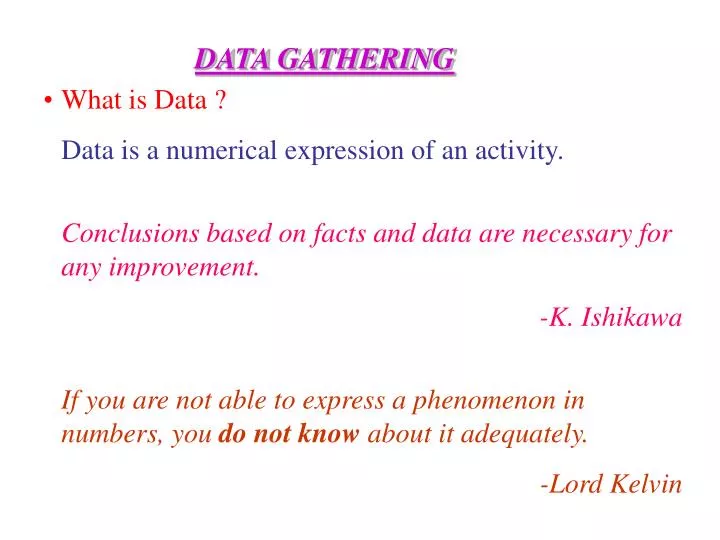
DATA GATHERING. What is Data ? Data is a numerical expression of an activity. Conclusions based on facts and data are necessary for any improvement. -K. Ishikawa If you are not able to express a phenomenon in numbers, you do not know about it adequately.

E N D
DATA GATHERING • What is Data ? • Data is a numerical expression of an activity. • Conclusions based on facts and data are necessary for any improvement. • -K. Ishikawa • If you are not able to express a phenomenon in numbers, you do not know about it adequately. • -Lord Kelvin
TYPES OF DATA • Data if properly collected • Least influenced by individual biases • Could be subject to critical analysis • Generally beyond language barriers and therefore universal in expression.
WHAT IS THE DIFFERENCE BETWEEN THE NUMBER OF SHAFTS REJECTED FOR OVERSIZE DIAMETER A SHAFT DIAMETER The diameter of a shaft can take any value ever after the decimal point e.g.. 19.055, 19.0516 etc.. Data related to this type of parameters are called Continuous data. The number of shaft rejected has necessarily to be a whole number. e.g.. 0, 2, 7, 10 numbers rejected etc.. Data related to this type of parameters are called Discrete data.
HOW DO YOU DISTINGUISH BETWEEN CONTINUOUS AND DISCRETE CONTINUOUS DISCRETE • They are real numbers • Normally, they are measured values • They can not take a single value. There is an area associated with it • They are continuous • Requires less sample size • They are whole numbers • Normally, they are counted values • They can take only ‘Zero’ or non-fractional positive values • They are in steps of ‘1’ • Requires more sample size to have the more precision
WHICH OF THE BELOW ARE CONTINUOUS AND DISCRETE DATA? • Width of sheet • No. of liners thinned • Tubes rejected by Go- Nogo Gauge • Diameter of Piston • Height of a Man • Sheet thickness • Out of 100 sheets the numbers that meet the thickness 4 0.9 • Time taken to process a purchase order • No. of bugs in a program
OBJECTIVES OF DATA COLLECTION • To know and quantify the status • To monitor the process • To decide acceptance or rejection • To analyse and decide the course of action • HOW TO COLLECT DATA ? • Define the purpose • Decide the type of analysis • Define the period of data collection • Is the the required data already available ?
FOR PROPER DATA COLLECTION... • Proper sampling procedure • Proper choice of instruments • Calibration of instruments used • Availability of standards for sensory characteristics • Adequate lighting and other test/inspection facilities. • Record all relevant information
WHAT IS VARIATION ? • No two things in nature are alike. • This is also true for manufactured products. • This dissimilarity between two products for the same characteristic is called variation. • The variation may be or can be made to be so small so as to make the product SEEM similar. • When we say that 2 things are similar we actually mean that it is not possible to measure the variation present within the accuracy of the existing measuring equipment. • Variation between 2 products are compared for SIMILAR features or characteristics.
TYPES OF VARIATION • Variations among pieces at the same time • Variations across time
6.50 6.55 7.00 This man wants to reach his work place by 6.55 a.m.. But he can not do so, exactly at 6.55 a.m. daily. Sometimes he reaches earlier (but almost never before 6.50 a.m.). Sometimes he reaches later (but almost never after 7.00 a.m.). WHY ? 6.55 a.m. 5 minutes.
THIS IS BECAUSE.... OF CERTAIN FACTORS WHICH • Affect the time he takes • He cannot control • Vary randomly e.g. The traffic you encounter under normal course of travel THE VARIATION THAT OCCURS DUE TO THESE KIND OF FACTORS IS CALLED INHERENT VARIATION OR COMMON CAUSE VARIATION OR WHITE NOISE. e.g.. m/c vibration,tool wear etc.
UNDER NORMAL SCHEME OF OPERATION Maximum deviation Inherent Variability (white noise) Aimed value Minimum deviation
6.30 • PROBABLY BECAUSE : • His watch was running fast. • He got a lift. • His bus driver took a shortcut. • He stayed over in the colony. • He had some important work to be finished before 7.30. TODAY HE IS EARLY !WHY ? These causes are characteristic of a specific circumstance and do not occur in the normal scheme of actions. Variation due to these types of reasons is called assignable or specialcause variation or black noise
GRAPHICAL DISPLAY OF VARIABILITIES CASE I TOTAL VAR I A B I L I T Y Assignable Variability Assignable Variability (Black noise) Inherent Variability Aimed Value Assignable Variability Assignable Variability CASE II CASE III
COMMON PROBLEMS WITH MEASUREMENTS • Problems with the measurements themselves 1. Bias or inaccuracy:The measurements have a different average value than a “standard” method. 2. Imprecision: Repeated readings on the same material vary too much in relation to current process variation. 3. Not reproducible:The measurement process is different for different operators, or measuring devices or labs. This may be either a difference in bias or precision. 4. Unstable measurement system over time:Either the bias or the precision changes over time. 5. Lack of resolution:The measurement process cannot measure to precise enough units to capture current product variation.
Good repeatability if variation is small * Data from repeated measurement of same item DESIRED MEASUREMENT CHARACTERISTICS FOR CONTINUOUS VARIABLES 1. Accuracy The measured value has little deviation from the actual value. Accuracy is usually tested by comparing an average of repeated measurements to a known standard value for that unit. 2. Repeatability The same person taking a measurement on the same unit gets the same result.
DESIRED MEASUREMENT CHARACTERISTICS FOR CONTINUOUS VARIABLES 3. ReproducibilityOther people (or other instruments or labs) get the same result you get when measuring the same item or characteristic. • * Small relative to • a) product variation and • b) product tolerance (the width of the product specifications)
DESIRED MEASUREMENT CHARACTERISTICS FOR CONTINUOUS VARIABLES 4. StabilityMeasurements taken by a single person in the same way vary little over time. Time 1 Observed value Time 2 Observed value Good stability if difference is Small* * Small relative to a) product variation and b) product tolerance (the width of the product specifications)
DESIRED MEASUREMENT CHARACTERISTICS FOR CONTINUOUS VARIABLES 5. Adequate Resolution There is enough resolution in the measurement device so that the product can have many different values. Good if 5 or more distinct values are observed
IMPROVING A MEASUREMENT SYSTEM • A measurement system consists of • Measuring devices • Procedures • Definitions • People • To improve a measurement system, you need to • Evaluate how well it works now (by asking “how much of the variation we see in our data is due to the measurement system?”). • Evaluate the results and develop improvement strategies.
NOTE ON CALIBRATING MEASUREMENT EQUIPMENT • Measurement instruments should only be recalibrated when they show special cause evidence of drift. Otherwise, variation could be increased by as much as 40%. This is because adjusting for true common cause variation adds more variation (Deming’s rule 2 of the funnel). Measurements taken from stable instrument Measurements taken with stable instrument recalibrated before each reading