Download
1 / 30
300 likes | 398 Views
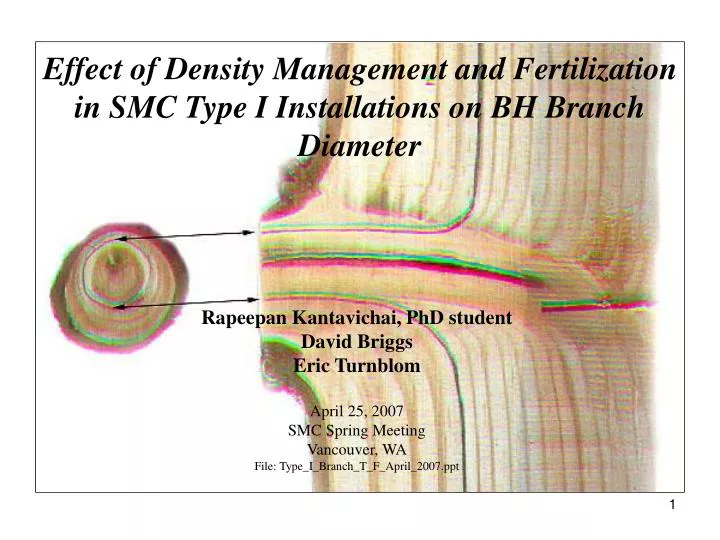
Effect of Density Management and Fertilization in SMC Type I Installations on BH Branch Diameter. Rapeepan Kantavichai, PhD student David Briggs Eric Turnblom April 25, 2007 SMC Spring Meeting Vancouver, WA File: Type_I_Branch_T_F_April_2007.ppt. Background.

E N D
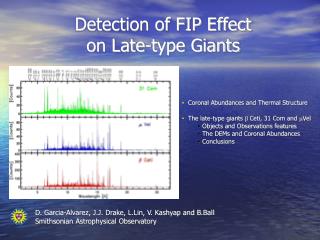
Effect of Density Management and Fertilization in SMC Type I Installations on BH Branch Diameter Rapeepan Kantavichai, PhD student David Briggs Eric Turnblom April 25, 2007 SMC Spring Meeting Vancouver, WA File: Type_I_Branch_T_F_April_2007.ppt
Is there a relationship between the branch index of a log and a simple tree measure? Knot diameter & product grade yield a. Largest knot on the log b.LLAD “largest limb average diameter” = branch index (bix) Grades of MSR Lumber Recovered Knot diameters observed on log surface Fahey, T.D., J.M. Cahill, GT.A. Snellgrove, L.S. Heath. 1991. Lumber and Veneer Recovery from Intensively managed Young-Growth Douglas-fir. PNW-RP-437. USDA Forest Service PNW Research Station, Portland, OR.
Is there a relationship between the LLAD of a log and a simple tree measure? • Focus on BH region • Simple to measure • Hypothesis: There is a relationship between the LLAD of a log and the diameter of the largest branch in the BH region (DLLBH) of the parent tree LLAD or BIX of 16 ft log Diameter of largest branch at bh region
Can translate a simple BH measurement into a log quality index or vice-versa DLLBH
Branch Diameter before crown recession • Before crown recession above the branch it isalive and growing • Diameter at stem surface is increasing • Thin effect on mean branch diameter of trees in a stand • Chainsaw effect increase, decrease, or not change depending on type of thinning • Response of residual stand increased diameter growth for a longer time (slower crown recession) • Fertilizer effect on mean branch diameter of trees in a stand • Increased growth • Growth models that predict branch diameter at crown recession do not reflect what is observed on log surface later next slide
Branch diameter after crown recession • After crown recession above the branch it is dead • Diameter at stem surface is decreasing (branch taper, loss of bark, shrinkage) • Thin effect on mean branch diameter of trees • Chainsaw effect increase, decrease, or not change depending on type of thinning • Response of residual stand may accelerate stem growth over dead tapered branch • Fertilizer effect on mean branch diameter of trees • May accelerate stem growth over the dead tapered branch
Sample • 6 plots x 9 installations = 54 plots • DLLBH from 2257 trees (about 40 trees/plot) • planted 1974-84 (289-690 tpa; ave 500) • established 1987-92 (age 6-13; ave 9) • fertilized with 200 lb N as urea at establishment & every 4 years since • 7 of 9 are King’s site class II; we used Flewelling’s SI in the analysis • 22-32 years old at DLLBH measurement (2002-2005) • Virtually all BH branches were dead!
Variables Defined on next slide
Crown Recession Variables • Time of crown recession above BH (death of the largest BH branch) • Number of years since establishment until the first 4-year measurement when the crown base was above BH; no interpolation. • Also know years since crown recession until the DLLBH measurement. • DLLBH decreases as the bole grows over dead branch (taper, bark loss, & shrinkage) Y_Until_CR (live branch) Y_Total = Y_Since_CR + Y_Until_CR Measurement points Offset due to bark Y_Since_CR (dead branch) 4 yrs 4 yrs 4 yrs 4 yrs Our measure of crown recession above BH; no interpolation Plot establishment
Confounding Problem with Stand Age • The 5 Installations planted 1980 & earlier were denser and on lower site quality than the 4 planted 1981 & later • Change in management planting philosophy • Bad luck in what was offered and when • AGE picks these historical patterns up branch diameter decreases with age not biologically meaningful so we dropped it.
Models • Model 1: Fixed treatment effects plus installation-wide pre-treatment stand variables • Model 2: Substitute actual post-treatment plot variables • Model 3: Use mean tree variables on each treatment plot • Model 4: Combination of tree, treatment effect, & stand
Statistical Analysis (all in SAS) • Backward elimination • Main effects • 2-way interactions (centered) • Fit & Assumption Checks • AIC, RMSE, R2adj • Residuals • Test normality & homogeneous variance • Hold-out procedure: use model based on 8 installations to predict 9th • Independent test: • Predict of DLLBH on other Type I’s
Model 1 Fixed treatment effects, installation-wide pre-treatment stand conditions, timing of crown recession above BH DLLBH = -8.745 ISPA1 – 5.322 ISPA2 - 2.244 ISPA4 + 2.121 FERT – 0.0059 ISTEMS + 1.439 SI30 + 1.674 IRD - 0.937 Y_Since_CR • (RMSE = 2.94, radj2 = 0.82) • No interactions were significant • DLLBH decreases with more original trees per acre and more time since the crown receded above BH (growth over dead tapered branches) • DLLBH increases if trees were on higher site quality and larger for the number of original trees and increases with PCT to wider spacing and use of fertilizer.
Model 2Individual plot stand conditions just after treatment, timing of crown recession above BH DLLBH = 23.441 + 2.371 FERT – 0.00755 (PSTEMS - 685) + 1.052 (SI30 – 26.5) - 0.825 (Y_Since_CR – 5) – 0.0011 (PSTEMS - 685) (SI30 – 26.5) + 0.000464 (PSTEMS - 685) (Y_Since_CR – 5) • (RMSE = 2.80, radj2 = 0.84) • DLLBH decreases with more trees per acre remaining after PCT and more time since the crown receded above BH (growth over dead tapered branches) • DLLBH increases if trees were on higher site quality with use of fertilizer. • The effect of site index is moderated by the density of trees higher density on a site results in lower DLLBH (earlier crown recession above BH hence longer time to grow over dead tapered branch) • The effect of Y_Since_CR is moderated by the density of trees higher densities increase DLLBH (slower rate of growth over dead tapered branch)
Model 3 Use Descriptors of Mean Tree on Treatment Plots DLLBH = 25.598 + 1.258 (DBH – 26.9) – 1.972 (HT – 18.8) – 0.0923 (HT – 18.8)(DBH – 26.9) • (RMSE = 2.52, radj2 = 0.87) • DLLBH decreases with greater dbh • DLLBH decreases with greater height; taller trees are likely to have a crown that has receded further above BH more time since branch death for bole to grow over dead tapered branches • The effect of dbh is moderated by height; taller trees reduce DLLBH more than shorter trees of the same DBH tall vs short trees differ in when crown recession occurs hence time to grow over a dead branch.
Model 4Combining Average Tree & Treatment/Stand Variables • DLLBH = 5.800 + 0.732 SI30 + 1.017 DBH – 1.351 HT – 0.387 Y_Since_CR (RMSE = 2.18, radj2 = 0.90) • DLLBH = 1.22 + 0.724 SI30 + 1.006 DBH – 1.487 HT + 0.094 CR (RMSE = 2.19, radj2 = 0.90) • DLLBH = 25.511+ 0.739 (SI30 – 26.5) – 0.363 (Y_Since_CR – 5.0) + 1.028 (DBH - 26.9) – 1.294 (HT – 18.8) – 0.069 (DBH - 26.9) (HT – 18.8) (RMSE = 1.99, radj2 = 0.92)
Model 5Can we use LIDAR? • Using just height, crown and tree count data • DLLBH = 2.241 + 0.38 CR (RMSE = 4.74, radj2 = 0.53) • If site index and treatment information from stand records are included the model improves • DLLBH = -14.497 + 2.61 FERT +1.079 SI30 -0.00525 PSTEMS -0.714 CL + 0.335 CR (RMSE = 2.95, radj2 = 0.82) • The potential for linking quality measures with LIDAR needs further exploration
Models 1, 2, 4a & 4c use Y_Since_CRNeed to estimate when crown recession occurs • At each 4-year measurement calculate the % of trees in each treatment plot with crown above BH (n = 241) • Logistic model: • Enter values for PSTEMS and SI and calculate % of trees with crown above BH as stand age increases (Table next slide) • Example: Suppore wish to estimate DLLBH at age 25 of a 1200 tpha stand growing on site 20m land
% of Trees with Crown above BHManager can decide on threshold, say 85% (yellow) Density, trees/ha Site index, m Site index, m Site index, m A stand with 1200 trees per hectare on a 20 m site will reach 85% crown recession above BH by age 22. Y_SINCE CR is measured after recession To estimate DLLBH, at age 25, Y_SINCE CR = 4
Models 3 and 4Use mean total height and mean DBH • User may have HT40 and QMD from a model • Conversion equations for the 54 plots: • DBH = -1.033 + 1.017 QMD (RMSE = 0.242, radj2 = 0.99) • HT = 0.15 + 0.845 HT40 (RMSE = 0.054, radj2 = 0.93)
Conclusion • At the treatment plot level, DLLBH can be predicted by several alternative formulations flexibility for adoption • Stand age is not in the DLLBH models; the older installations were planted more densely and on lower sites than the newer installations so density and site variables prevailed. • Connectivity with LIDAR is promising and should be explored further. • WARNING: Remember all BH branches were dead! These models would not be appropriate to use for trees with the live crown below BH.
Future • Counterpart models for predicting DLLBH for individual trees is underway and looks promising will present at IUFRO Forest Growth and Wood Quality Conference, Portland, OR. August 7-10, 2007. • Extending the crown recession model to predict % of trees in a stand with the crown recession to any height (multinomial logit). • Type III’s would be interesting so we can capture dynamics before/after crown recession above BH.