Download
1 / 41
410 likes | 412 Views
This lecture introduces the importance of epigenetic data in understanding transcriptional regulation, predicting transcription factor binding sites, and Gaussian process models. It explains the concept of epigenetics, experiments that reveal the context of DNA sequence, and the different states and modifications of DNA. The lecture also discusses the limitations of using position weight matrices (PWMs) for motif scanning, the mapping of regulatory elements genome-wide using ChIP-seq and DNase I hypersensitivity, histone modifications, DNA methylation, 3D organization of chromatin, large-scale epigenetic maps, genome annotation, and predicting TF binding using DNase-Seq and DNase I footprints.

E N D
Epigenetics and DNase-Seq BMI/CS 776 www.biostat.wisc.edu/bmi776/ Spring 2018 Anthony Gitter gitter@biostat.wisc.edu These slides, excluding third-party material, are licensed under CC BY-NC 4.0 by Anthony Gitter, Mark Craven, and Colin Dewey
Goals for lecture Key concepts • Importance of epigenetic data for understanding transcriptional regulation • Predicting transcription factor binding sites • Gaussian process models
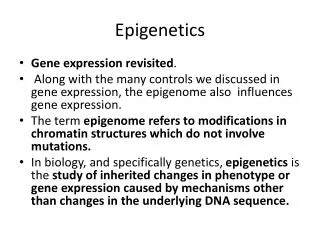
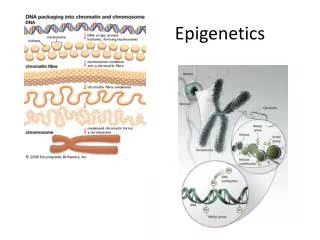
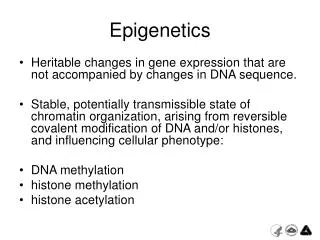
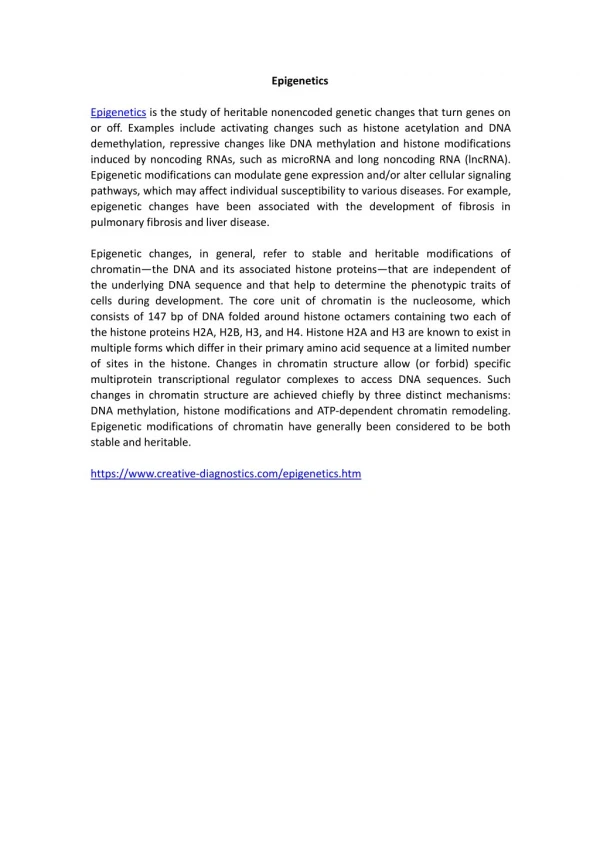
Defining epigenetics • Formally: attributes that are “in addition to” genetic sequence or sequence modifications • Informally: experiments that reveal the context of DNA sequence • DNA has multiple states and modifications G A C T A G T G C G T T A C T modification vs. inaccessible G T G C G T T A C T A T C Histones A G
Importance of epigenetics Better understand • DNA binding and transcriptional regulation • Differences between cell and tissue types • Development and other important processes • Non-coding genetic variants (next lecture)
PWMs are not enough • Genome-wide motif scanning is imprecise • Transcription factors (TFs) bind < 5% of their motif matches • Same motif matches in all cells and conditions
PWMs are not enough • DNA looping can bring distant binding sites close to transcription start sites • Which genes does an enhancer regulate? Promoter: DNA binding site for TFs, close to gene transcription start site Enhancer: DNA binding site for TFs, can be far from affected gene Nature Education 2010
Mapping regulatory elements genome-wide • Can do much better than motif scanning with additional data • ChIP-seq measures binding sites for one TF at a time ShlyuevaNature Reviews Genetics 2014 • Epigenetic data suggests where some TF binds
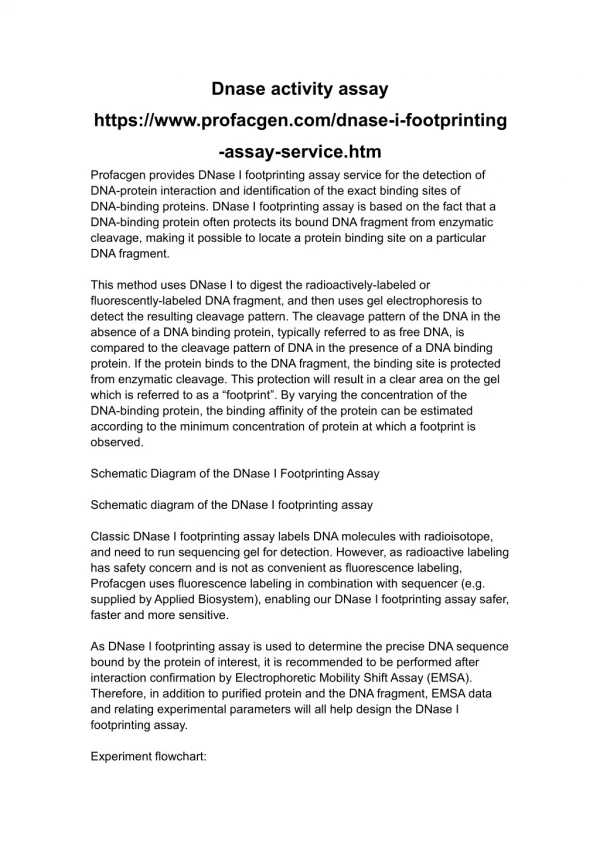
DNase I hypersensitivity • Regulatory proteins bind accessible DNA • DNase I enzyme cuts open chromatin regions that are not protected by nucleosomes Nucleosome: DNA wrapped around histone proteins Wang PLoS ONE 2012
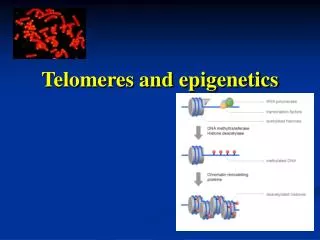
Histone modifications • Mark particular regulatory configurations • H3 (protein) K27 (amino acid) ac (modification) Two copies of histone proteins H2A, H2B, H3, H4 ShlyuevaNature Reviews Genetics 2014 Latham Nature Structural & Molecular Biology 2007; Katie Ris-Vicari
DNA methylation • Reversible DNA modification • Represses gene expression OpenStax CNX
3d organization of chromatin • Algorithms to predict long range enhancer-promoter interactions • Or measure with chromosome conformation capture (3C, Hi-C, etc.) Rao Cell 2014
3d organization of chromatin • Hi-C produces 2d chromatin contact maps • Learn domains, enhancer-promoter interactions 500 kb 50 kb 5 kb Rao Cell 2014
Large-scale epigenetic maps • Epigenomes are condition-specific • Roadmap EpigenomicsConsortium and ENCODE surveyed over 100 types of cells and tissues Roadmap EpigenomicsConsortium Nature 2015
Genome annotation • Combinations of epigenetic signals can predict functional state • ChromHMM: Hidden Markov model • Segway: Dynamic Bayesian network Roadmap EpigenomicsConsortium Nature 2015
Genome annotation • States are more interpretable than raw data Ernst and KellisNature Methods 2012
DNase I hypersensitive sites • Arrows indicate DNase I cleavage sites • Obtain short reads that we map to the genome Wang PLoS ONE 2012
DNase I footprints • Distribution of mapped reads is informative of open chromatin and specific TF binding sites ChIP-Seq peak I Read depth at each position Nucleosome free “open” chromatin Zoom in TF binding prevents DNase cleavage leaving Dnase I “footprint”, only consider 5′ end NephNature 2012
DNase I footprints to TF binding predictions • DNase footprints suggest that some TF binds that location • We want to know which TF binds that location • Two ideas: • Search for DNase footprint patterns, then match TF motifs • Search for motif matches in genome, then model proximal DNase-Seq reads We’ll consider this approach
Protein Interaction Quantification (PIQ) • Sherwood et al. Nature Biotechnology 2014 • Given: TF motifs and DNase-Seq reads • Do: Predict binding sites of each TF Rieck and Wright Nature Biotechnology 2014
PIQ main idea • With no TF binding, DNase-Seq reads come from some background distribution • TF binding changes read density in a TF-specific way Background TF effects
PIQ main idea • Shape of DNase peak and footprint depend on the TF TF A TF B Sherwood Nature Biotechnology 2014
PIQ features • We’ll discuss • Modeling the DNase-Seq background distribution • How TF binding impacts that distribution • Priors on TF binding • We’ll skip • Modeling multiple replicates or conditions, cross-experiment and cross-strand effects • Expectation propagation • TF hierarchy: pioneers, settlers, migrants
Algorithm preview • Identify candidate binding sites with PWMs • Build a probabilistic model of the DNase-Seq reads • Estimate TF binding effects • Estimate which candidate binding sites are bound • Predict pioneer, settler, and migrant TFs
DNase-Seq background • Each replicate is noisy, don’t want to over-interpret this noise • Only counting density of 5′ ends of reads • Manage two competing objectives • Smooth some of the noise • Don’t destroy base pair resolution signal
Gaussian processes • Can model and smooth sequential data • Bayesian approach • Jupyter notebook demonstration
TF DNase profile • Adjust the log-read rate by a TF-specific effect at binding sites DNase profile for factor l Whether site m is bound DNase log-read rate adjusted for binding of factor l Location of binding site m Window size DNase log-read rate at position ifrom Gaussian process
TF DNase profile • DNase profiles represented as a vector for each TF DNase profile for factor l Can’t be too far apart I … …
Priors on TF binding Example only, not realistic data • TF binding event should be more likely when • motif score is high • DNase counts are high • Isotonic (monotonic) regression Wikipedia
Full algorithm • Given: TF motifs and DNase-Seqreads • Do: Predict binding sites of each TF • Identify candidate binding sites with PWMs • Fit Gaussian process parameters for background • Estimate TF binding effects • Iterate until parameters converge • Estimate Gaussian process posterior with expectation propagation • Estimate expectation of which candidate binding sites are bound • Update monotonic regression functions for binding priors
TF binding hierarchy • Pioneer, settler, and migrant TFs Sherwood Nature Biotechnology 2014
Evaluation: confusion matrix • Compare predictions to actual ground truth (gold standard) Lever Nature Methods 2016
Evaluation: ChIP-Seq gold standard Sung Molecular Cell 2014
Evaluation: ROC curve • Calculate receiver operating characteristic curve (ROC) • True Positive Rate versus False Positive Rate • Summarize with area under ROC curve (AUROC) Includes true negatives Reason to prefer precision-recall for class imbalanced data
Evaluation: ROC curve Candidate P(bound) binding site 764 0.99 470.96 9420.91 157 0.87 79 0.83 2020.72 3560.66 6790.51 2910.43 8100.40 … • TPR and FPR are defined for a set of positive predictions • Need to threshold continuous predictions • Rank predictions • ROC curve assesses all thresholds Positive predictions t Negative predictions Calculate TPR and FPR at all thresholds t
PIQ ROC curve for mouse Ctcf • Compare predictions to ChIP-Seq • Full PIQ model improves upon motifs or DNase alone Sherwood Nature Biotechnology 2014
PIQ evaluation • Compare to two standard methods • 303 ChIP-Seq experiments in K562 cells • Centipede, digital genomic footprinting • Compare AUROC • PIQ has very high AUROC • Mean 0.93 • Corresponds to recovering median of 50% of binding sites Sherwood Nature Biotechnology 2014
DNase-Seq benchmarking • PIQ among top methods in large scale DNase benchmarking study • HMM-based model HINT was top performer GusmaoNature Methods 2016
Downside of AUROC for genome-wide evaluations Almost all methods look equally good when using full ROC curve AUROC close to 1.0 Precision-recall curve or truncated ROC curve differentiate methods GusmaoNature Methods 2016
PIQ summary • Smooth noisy DNase-Seq data without imposing too much structure • Combine DNase-Seq and motifs to predict condition-specific binding sites • Supports replicates and multiple related conditions (e.g. time series)