Download
1 / 44
440 likes | 525 Views
Smolt Survival and Travel Time and Adult Return Rates for Salmonids in the Snake and Columbia Rivers Update with 2012 Data. Technical Management Team Year-End Review December 5, 2012 Steve Smith steven.g.smith@noaa.gov Northwest Fisheries Science Center NOAA Fisheries. Outline.

E N D
Smolt Survival and Travel Time and Adult Return Rates for Salmonids in the Snake and Columbia Rivers Update with 2012 Data Technical Management Team Year-End Review December 5, 2012 Steve Smith steven.g.smith@noaa.gov Northwest Fisheries Science Center NOAA Fisheries
Outline • Summary of migration conditions, travel time and survival of PIT-tagged smolts through the hydropower system • - October 12 Memo; Report to BPA in process • Information from return of PIT-tagged adults – transported from and bypassed at Lower Granite • - Report to USACE in revision; completion imminent
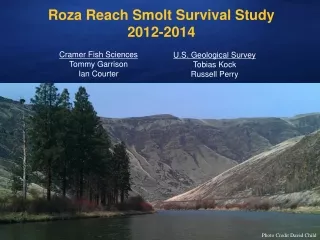
Chief Joseph Wells GrandCoulee Rocky Reach Rock Island Wanapum Ice Harbor Priest Rapids Lower Granite Little Goose Lower Monumental McNary John Day Bonneville The Dalles Hells Canyon Oxbow Brownlee PIT-tag Data Sources Hatchery Releases Snake R. trap Juvenile detectors Hatchery & Trap Releases PIT tag trawl
87.1 (93.3) 91.8 93.9 94.0 91.5 92.8 BON JDA MCN LMO LGO LGR SRT 81.7 (90.1) 89.8 87.2 94.2 93.4 94.9 Yearling Chinook salmon reach survival LGR LGO LMO 95.2 SRT 99.1 ICE BON JDA TDA MCN 2012 Mean 02-12
102.1 (101.0) 81.4 81.1 91.4 95.8 100.1 BON JDA MCN LMO LGO LGR SRT 77.7 (87.8) 83.4 76.0 91.3 93.2 97.1 Steelhead reach survival LGR LGO LMO 88.2 SRT 92.4 ICE BON JDA TDA MCN 2012 Mean 02-12
Conclusions • 2009 through 2012 juvenile steelhead survival estimates are the highest in the time series • Likely contributing factors include relatively high spill rates and increased migration rate, promoted by additional surface passage structures • Residualization is reduced when time in river is reduced
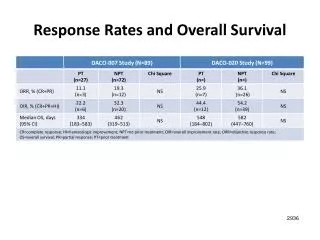
Preliminary estimates of transport % for 2012 based on PIT-tag data • 23% wild Chinook • 25% hatchery Chinook • 28% wild steelhead • 27% hatchery steelhead
Preliminary estimates of transport % • 67% of Chinook and 59% of steelhead passed LGR before transportation began on May 2 • After transportation started: about 58% of smolts that arrived at LGR were transported
Conclusions • Through direct and indirect effects, recent management actions have: • increased number of in-river migrants • increased survival of those remaining in-river • (esp. steelhead) • not necessarily increased smolt-to-adult survival for the population • to improve survival to adult for population, in-river increases have to exceed benefit of transport
Estimating SAR with PIT-tags • Estimates of smolt-to-adult return using PIT-tagged fish may be 10%-35% lower than SAR for unmarked fish • USFWS study under way at Carson NFH – first adults in 2012 • NOAA developing proposal to study in Alaska hatcheries
Estimating Seasonal SAR • Need a “time-stamp” • We use fish detected at LGR – transported vs. bypassed • Relative SAR = “T:B Ratio”
Transported Bypassed Transported Bypassed Transported Bypassed Transported Bypassed
Transported Bypassed Transported Bypassed Transported Bypassed Transported Bypassed
Transported Bypassed Transported Bypassed Transported Bypassed Transported Bypassed
Transported Bypassed Transported Bypassed T:B Ratio T:B
Transported Bypassed Transported Bypassed T:B Ratio T:B
Transported Bypassed Transported Bypassed T:B Ratio T:B
Transported Bypassed Transported Bypassed T:B Ratio T:B
Transported Bypassed Transported Bypassed T:B Ratio T:B
Transported Bypassed Transported Bypassed T:B Ratio T:B
Conclusion • Benefit of transportation was reduced in 2006-2008 relative to earlier years • - due to improved conditions for in-river migrants • Return rate for transported fishstill exceeded that for in-river migrants for most of the season