Download
1 / 30
300 likes | 372 Views
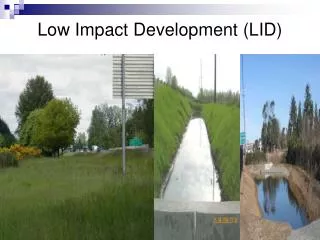
Low Impact Development Pollutant Detections In Runoff From California Neighborhoods. Loren Oki UC Davis, Plant Sciences Darren Haver UC Cooperative Extension, Orange County Low Impact Development Conference October 6, 2010. Project Background.

E N D
Low Impact DevelopmentPollutant Detections In Runoff From California Neighborhoods Loren OkiUC Davis, Plant Sciences Darren HaverUC Cooperative Extension, Orange County Low Impact Development Conference October 6, 2010
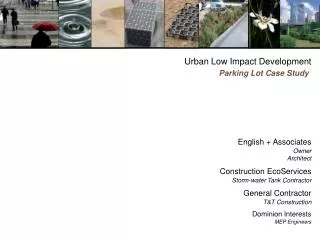
Project Background Evaluating Best Management Practices (BMP) effectiveness to reduce volumes and improve quality of runoff from urban environments Funding provided by: California State Water Resources Control Board CALFED Bay-Delta Program
Project Objectives Characterize runoff Single family residences Pesticides, nutrients, drinking water COCs, pathogen indicators Determine flowvolumes Develop pollutantloading models Dry and wet season Measure outreacheffects
Site Selection 8 sites 4 each in Sacramento (N. Cal) and Orange (S. Cal) Counties Criteria Single family homes 4-20 years old Lot size Demographics
Sampling Schedule Water Sample Collection • Sampling by Master Gardeners in Sac Co • Up to 5 early storms of each season
Continuous Data Collection Flows (depth & velocity) Temperature pH Electrical conductivity Rainfall Automated StormwaterSampling Remote Communication Monitoring Photos: L.Oki
Continuous Data Collection Flows (depth & velocity) Temperature pH Electrical conductivity Rainfall Automated StormwaterSampling Remote Communication Monitoring Photos: L.Oki
Water Sample Collection UC Cooperative ExtensionMaster Gardeners Photos: L.Oki
Analyses of Water Samples UC Riverside Gan Lab Nutrients Nitrate, TKN, Phosphate, Total P Pesticides diazinon, chlorpyrifos, pyrethroids (9), fipronil Drinking Water COCs TOC, DOC, Brˉ, Clˉ, TDS, TSS, turbidity Yates Lab Pathogen indicatorsE. coliTotal coliforms Somatic coliphages Male-specific coliphages EnterococciClostridium perfringens PathogensGiardia Cryptosporidium
Pesticide Detection Frequency Sacramento County As reported Sep 18, 2008 Detection limit= 0.5 ng/L n=62 Fipronil Pyrethroids % Detection OPs
Pesticide Detection Frequency Sacramento County Orange County n=56 n=52 % Detection n=49 n=62 Fipronil Pyrethroids % Detection OPs
Bifenthrin Concentration- S Cal S2 nn=70 ns= 9 300
Bifenthrin Concentration- S Cal 300 300 S2 S1 nn=60 ns= 9 nn=70 ns= 9 300 300 S3 S4 nn=69 ns= 9 nn=60 ns= 9 Graphics: E. Lee
Bifenthrin Concentration- N Cal 150 150 nn = 80 ns = 11 N2 F1 N1 F2 nn = 84 ns = 11 150 150 nn = 70 ns = 7 nn = 77 ns = 11 N3 N4 Nat
Intensive Dry Weather Sampling Dry weather grab sampling N. California- Tuesdays, 11:00-2:00 S. California- Wednesdays, 7:00-11:00 Hourly sampling for 7 days S. California Site June 16– 23, 2008 N. California Site July 23-30, 2008
Sample Collection & Analyses 12 sample composite 3 sample composite DiazinonChlorpyrifos Fipronil BifenthrinFenpropathrinL-Cyhalothrincis-Permethrintrans-PermethrinCyfluthrinEsfenvalerateDeltamethrin TOC TSS Nitrate Orthophosphate pH EC Turbidity 1 grab sample every 24 hrs for biologicals
Synthetic Pyrethroids Bifenthrin Southern California Northern California
Fipronil Southern California Northern California 2,884.5 ppt
Dry season runoff patterns TueJuly 1 WedJuly 2 ThuJuly 3 FriJuly 4 SatJuly 5 SunJuly 6 MonJuly 7 Water Depth (cm) Time of Day Daily Periodicity Graphics: L. Oki
Dry season runoff patterns Daily Periodicity TueJuly 1 WedJuly 2 ThuJuly 3 FriJuly 4 SatJuly 5 SunJuly 6 MonJuly 7 Water Depth (cm) Time of Day Graphics: L. Oki
4 Test neighborhoods Current county land useLow & Very Low Density 50-year projected land use Wet & Dry seasons Pollutant Loading Model Multi-Scale Graphics: A. Manfree
Graphics: A. Manfree Pollutant Load ModelingLow & Very Low Density Residential Zones
Storm and Non-storm RunoffLow and Very Low Density Residential Land Use Sacramento County 38,680 acre-ft 181,911 acre-ft Graphics: A. Manfree
Thank you lroki@ucdavis.edu dlhaver@ucdavis.edu
Site Selection Storm drain maps Locate outfalls Delineate drainshed Identify lots Verify land use Visit outfalls Safe access
Evaluating Outreach Methods UC Master Gardener Advanced Training • Project outline • Controlled experiments • Residential landscape studies • Load estimation • Economic evaluation of BMP effectiveness • Outreach of results • Local, statewide, regional
Evaluating Outreach Methods Community Activities
California Center for Urban Horticulture ccuh.ucdavis.edu