Download
1 / 1
10 likes | 115 Views
Evaluating Projected Changes in Mean Processes, Extreme Events, and their Spatio-Temporal Dependence Structures Auroop R. Ganguly* 1 , Karsten Steinhaeuser 1 , Evan Kodra 1 , Shih-Chieh Kao 1 , Subimal Ghosh 2 1 Oak Ridge National Laboratory 2 Indian Institute of Technology, Bombay.

E N D
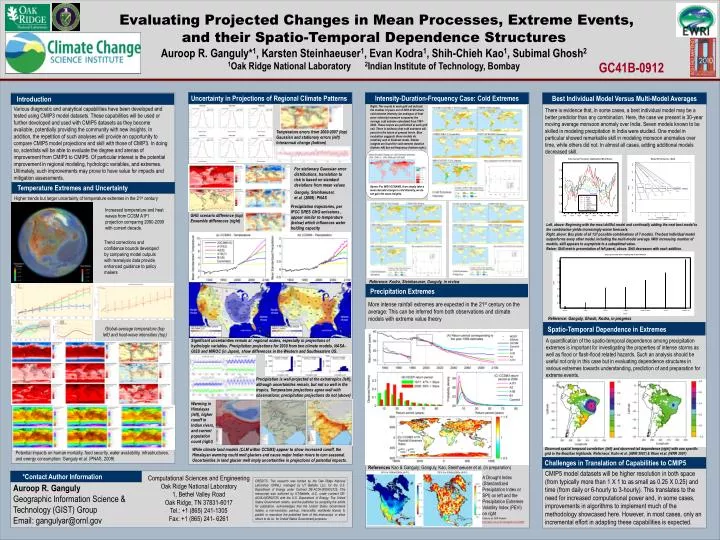
Evaluating Projected Changes in Mean Processes, Extreme Events, and their Spatio-Temporal Dependence StructuresAuroop R. Ganguly*1, Karsten Steinhaeuser1, Evan Kodra1, Shih-Chieh Kao1, Subimal Ghosh2 1Oak Ridge National Laboratory 2Indian Institute of Technology, Bombay GC41B-0912 Uncertainty in Projections of Regional Climate Patterns Intensity-Duration-Frequency Case: Cold Extremes Best Individual Model Versus Multi-Model Averages Introduction Right: The counts in each grid cell indicate the number of years out of 2091-2100 where cold extreme intensity (an analogue of heat wave intensity) measure surpasses the average cold extreme calculated from 1991-2000. These counts are performed at each grid cell. There is evidence that cold extremes will persist in the future at present levels. Bias evaluation suggests these models do relatively well in hindcast mode. Similar insights are found for cold extreme duration (bottom left) but not frequency (bottom right.). Various diagnostic and analytical capabilities have been developed and tested using CMIP3 model datasets. These capabilities will be used or further developed and used with CMIP5 datasets as they become available, potentially providing the community with new insights. In addition, the repetition of such analyses will provide an opportunity to compare CMIP5 model projections and skill with those of CMIP3. In doing so, scientists will be able to evaluate the degree and arenas of improvement from CMIP3 to CMIP5. Of particular interest is the potential improvement in regional modeling, hydrologic variables, and extremes. Ultimately, such improvements may prove to have value for impacts and mitigation assessments. There is evidence that, in some cases, a best individual model may be a better predictor than any combination. Here, the case we present is 30-year moving average monsoon anomaly over India. Seven models known to be skilled in modeling precipitation in India were studied. One model in particular showed remarkable skill in modeling monsoon anomalies over time, while others did not. In almost all cases, adding additional models decreased skill. Temperature errors from 2000-2007 (top) Gaussian and stationary errors (left) Interannual change (bottom) Above: For INGV ECHAM4, if we simply take a mean decadal change in cold intensity, we do not gain the same insights. For stationary Gaussian error distributions, translation to risk is based on standard deviations from mean values Temperature Extremes and Uncertainty Ganguly, Steinhaeuser, et al. (2009): PNAS Higher trends but larger uncertainty of temperature extremes in the 21st century Precipitation trajectories, per IPCC SRES GHG emissions , appear similar to temperature (below) which influences water holding capacity Increased temperature and heat waves from CCSM A1FI projection comparing 2090-2099 with current decade. GHG scenario difference (top) Ensemble differences (right) Left, above: Beginning with the most skillful model and continually adding the next best model to the combination yields increasingly worse forecasts. Right, above: Box plots of all 127 possible combinations of 7 models. The best individual model outperforms every other model, including the multi-model average. With increasing number of models, skill appears to asymptote to a suboptimal value. Below: Skill metric presentation of left panel, above. Skill decreases with each addition. Trend corrections and confidence bounds developed by comparing model outputs with reanalysis data provideenhanced guidance to policy makers Reference: Kodra, Steinhaeuser, Ganguly, in review Precipitation Extremes More intense rainfall extremes are expected in the 21st century on the average: This can be inferredfrom both observations and climate models with extreme value theory Reference: Ganguly, Ghosh, Kodra, in progress Spatio-Temporal Dependence in Extremes Global-average temperature (top left) and heat-wave intensities (top) A quantification of the spatio-temporal dependence among precipitation extremes is important for investigating the properties of intense storms as well as flood or flash-flood related hazards. Such an analysis should be useful not only in this case but in evaluating dependence structures in various extremes towards understanding, prediction of and preparation for extreme events. Significant uncertainties remain at regional scales, especially in projections of hydrologic variables. Precipitation projections for 2030 from two climate models, NASA-GISS and MIROC (in Japan), show differences in the Western and Southeastern US. Precipitation is well-projected at the extratropics (left), although uncertainties remain, but not so well in the tropics. Temperature projections agree well with observations; precipitation projections do not (above) Warming in Himalayas (left), higher runoff in Indian rivers, and current population count (right) Observed spatial temporal correlation (left) and observed tail dependence (right) with one specific grid in the Brazilian highlands. Refernece: Kuhn et al. (AWR 2007) & Khan et al. (WRR 2007) While climate land models (CLM within CCSM3) appear to show increased runoff, the Himalayan warming could melt glaciers and cause major Indian rivers to turn seasonal. Uncertainties in land glacier melt imply uncertainties in projections of potential impacts. Potential impacts onhuman mortality, food security, water availability, infrastructures, and energy consumption: Ganguly et al. (PNAS, 2009) Challenges in Translation of Capabilities to CMIP5 References Kao & Ganguly; Ganguly, Kao, Steinhaeuser et al. (in preparation) CMIP5 model datasets will be higher resolution in both space (from typically more than 1 X 1 to as small as 0.25 X 0.25) and time (from daily or 6-hourly to 3-hourly). This translates to the need for increased computational power and, in some cases, improvements in algorithms to implement much of the methodology showcased here. However, in most cases, only an incremental effort in adapting these capabilities is expected. *Contact Author Information Computational Sciences and Engineering Oak Ridge National Laboratory 1, Bethel Valley Road Oak Ridge, TN 37831-6017Tel.: +1 (865) 241-1305 Fax: +1 (865) 241- 6261 A Drought Index (Standardized Precipitation Index or SPI) on left and the Precipitation Extremes Volatility Index (PEVI) on right Citations on QDR Website: http://www.ornl.gov/knowledgediscovery/QDR/ CREDITS: This research was funded by the Oak Ridge National Laboratory (ORNL), managed by UT Battelle, LLC, for the U.S. Department of Energy under Contract DE-AC05-00OR22725. This manuscript was authored by UT-Battelle, LLC, under contract DE-AC05-00OR22725 with the U.S. Department of Energy. The United States Government retains, and the publisher by accepting the article for publication, acknowledges that the United States Government retains, a non-exclusive, paid-up, irrevocable, worldwide license to publish or reproduce the published form of this manuscript, or allow others to do so, for United States Government purposes. Auroop R. Ganguly Geographic Information Science & Technology (GIST) Group Email: gangulyar@ornl.gov