Download
1 / 11
120 likes | 133 Views
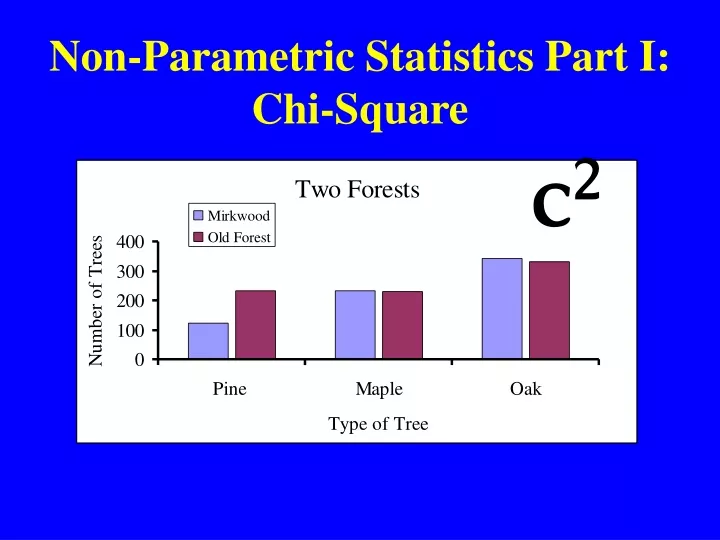
Non-Parametric Statistics Part I: Chi-Square. c 2. x 2 Operates on FREQUENCY Data. Suppose we have a plot of land on which we hope to harvest wood. Maple is more valuable than Oak and Oak more valuable than pine. We take a sample of the trees (the whole plot is too big) and we

E N D
x2 Operates on FREQUENCY Data Suppose we have a plot of land on which we hope to harvest wood. Maple is more valuable than Oak and Oak more valuable than pine. We take a sample of the trees (the whole plot is too big) and we ask whether there are significantly unequal amounts of each type (a=.05). We cannot get a mean from these data but there are clear differences between the amounts in each category. This is categorical or nominal data experessed as frequencies. So we use the x2
x2 :Homogeneity What are the null and alternative hypotheses? H0: The groups do not have different frequencies. H1: The groups do have different frequencies. Find the critical value: x2 table (k-1 df = 3-1= 2) = 5.99 Calculate the obtained statistic: = (145 + 301 + 289)/3 = 245 245 245 245 = 61.52 Make a decision: Our obtained value is larger than our critical value. Reject the null; the groups do have different frequencies.
x2 :Homogeneity Example Is political affiliation distributed equally in our class? (use alpha=.01) What are the null and alternative hypotheses? H0: The groups do not have different frequencies. H1: The groups have different frequencies. Find the critical value: x2 table (k-1 df = 3-1= 2) = 9.21 Calculate the obtained statistic: = (10 + 15 + 5)/3 = 10 # of people expected 10 10 10 = 5 Make a decision: Our obtained value is smaller than our critical value. Retain the null; the groups do not have different frequencies.
x2 :Goodness of Fit We need a different expected value based on the previous sample. Five years ago the tree-lot was also sampled. Has the composition of the lot changed since then (use alpha=.05)? Total # 735 473 Pine proportion = 255/473 = 0.54 Maple proportion = 115/473 = 0.24 Oak proportion = 103/473 = 0.22 Notice we’re trying to compare the frequencies from two time points, but the total # of trees categorized in 2014 is different from the 2009 total! Pine expected = 0.54(735) = 396.9 Maple expected = 0.24(735) = 176.4 Oak expected = 0.22(735) = 161.7
x2 :Goodness of Fit Example What are the null and alternative hypotheses? H0: The composition of the lot has not changed. H1: The composition of the lot has changed. Find the critical value: x2 table (k-1 df = 3-1= 2) = 5.99 Calculate the obtained statistic: = 348.10 Make a decision: Our obtained value is larger than our critical value. Reject the null; the composition of the lot has changed.
x2 :Independence Pine Maple Oak Mirkwood 123 234 345 Old Forest 233 232 333 H0: Tree type and Forest are independent. H1: Tree type and Forest are not independent.
x2 :Independence Example (assume alpha=.05) What are the null and alternative hypotheses? H0: Tree type and forest are independent. H1: Tree type and forest and not independent. Find the critical value: df for this test is (r-1)(c-1) We have 2 rows and 3 columns, so (2-1)(3-1) = 2 x2 table (df = 2) = 5.99 Calculate the obtained statistic:
x2 :Independence How to calculate expected values: Pine Maple Oak Mirkwood 123 234 345 Old Forest 233 232 333 R 702 798 356 C 466 678 Grand Total: 1500 Expected value = (R x C)/ grand total Expected Mirkwood-Pine = (702 x 356)/1500 = 166.61 Expected Old Forest-Pine = (798 x 356)/1500 = 189.39
( O - E)2 x2= E S x2 :Independence Observed Values Expected Values Pine Maple Oak Mirkwood166.8 218.1 317.3 Old Forest 189.4 247.9 360.7 Pine Maple Oak Mirkwood 123 234 345 Old Forest 233 232 333 = 28.18
x2 :Independence Example (assume alpha=.05) What are the null and alternative hypotheses? H0: Tree type and forest are independent. H1: Tree type and forest and not independent. Find the critical value: df for this test is (r-1)(c-1) We have 2 rows and 3 columns, so (2-1)(3-1) = 2 x2 table (df = 2) = 5.99 28.18 Calculate the obtained statistic: Make a decision: Our obtained value is larger than our critical value. Reject the null; tree type and forest are not independent.