Download
1 / 13
130 likes | 226 Views
The distribution of species: Edge length, number of patches and occupancy. Fangliang He Department of Renewable Resources University of Alberta. Map agreement / thematic classification accuracy Image restoration Interpreting occurrence using external variables Cluster delineation

E N D
The distribution of species: Edge length, number of patches and occupancy Fangliang He Department of Renewable Resources University of Alberta
Map agreement / thematic classification accuracy • Image restoration • Interpreting occurrence using external variables • Cluster delineation • Estimating species abundance
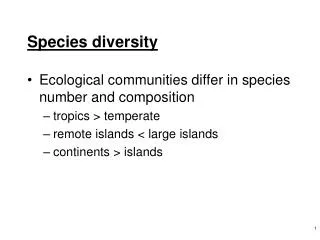
Three basic landscape metrics • Occupancy, p • Edge length, L • Number of patches, T
Objectives • Developing models to tie the three metrics together • Shedding some light on the question concerning landscape fragmentation, e.g., how much landscape fragmentation is too much?
Edge length-occupancy model (bond percolation model) p 1 - p Probability of black-white join = p(1-p) Total expected # of b-w joins: L = 2J•p•(1-p) where J is the total number of neighboring joins. J = 2JxJy-Jx-Jy, where Jx is the number of cells along x axis He & Hubbell, PRL (2003)
Cluster number-occupancy model (Site percolation model)
Inflexion Not a percolation threshold
198 bird distributions in the Czech Republic • Blue area is Czech • Red cells: the distribution of a bird
Mechanisms Geometries Conclusions ?