Download
1 / 21
210 likes | 363 Views
Warm Up What are the 2 ways that you can determine if something is a function? For #’s 2 – 3, determine if it is a function, state the domain, and the range. {(2,4), (3, 6), (5,1), (4,4)} {(-2 5), (-2,8), (5,9)} For #’s 4 – 6, determine if it is a function. Why?. 4. 5.

E N D
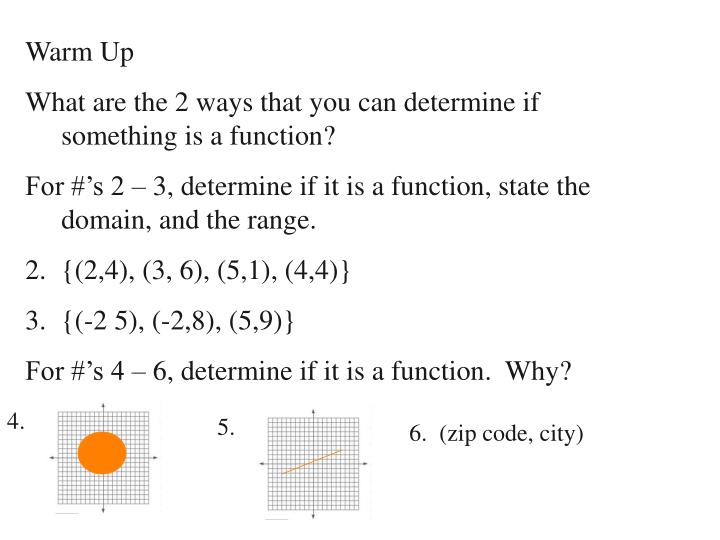
Warm Up • What are the 2 ways that you can determine if something is a function? • For #’s 2 – 3, determine if it is a function, state the domain, and the range. • {(2,4), (3, 6), (5,1), (4,4)} • {(-2 5), (-2,8), (5,9)} • For #’s 4 – 6, determine if it is a function. Why? 4. 5. 6. (zip code, city)
Lesson 9.4 Interpreting Graphs
BOOM! BOOM! Describe, read, and interpret graphs of real-world situations. 2. Make appropriate graphs of real-world situations. OBJECTIVES: Describe, read, and interpret graphs of real-world situations. 2. Make appropriate graphs of real-world situations.
Linear vs. Nonlinear What does it mean if a function is linear? As x increases at a constant rate, the function values change at a constant rate.
Linear vs. Nonlinear What does it mean if a function is non-linear? As x changes at a constant rate, the function values change at a varying rate.
Examples: Decide if the following situations would be represented by a linear or non-linear function. For every hour you baby-sit, you receive $5 in pay. The temperature of a hot meal and the number of minutes it sits on the table without being eaten. linear Non-linear
Types of movement In real life graphs, the graph can only do three things. The graph can rise or grow. The graph can fall or go down. The graph can stay the same. There can be a combination of the three movements, but only one movement at a time, ie, you can’t be growing and shrinking at the same time.
Increasing Graphs Technical Definition: As the x values increase, the y values also increase. Example One important thing to remember about graphs is how fast they are rising or falling. This changes how “steep” the graph is.
More Examples Here are some other types of Increasing graphs.
Real life situations When you get to Calculus you can worry about actual numbers, but for this class we are just interested in the “general idea” of what the graph is doing. Hint: A helpful way to read these graphs is to use the “as…then…” statement. The bottom label (x value- the independent variable) goes after the as and the left label (y value – the dependent variable) goes after the then. Dependent Independent
For example: This graph could be several real life situations. It could be earnings for time worked at Subway.
Or it could be a man’s distance away from his house as he is walking. How about the crazy level of Mrs. Falkner?
Your Turn Come up with your own stories for the following graphs. Hint: When writing your own story, you have to take into account the steepness of your graph. Is your story happening fast or slow?
Decreasing Graphs Definition: As the x value increases, the y value decreases. Examples: All of the graphs are decreasing: some are decreasing quickly, others are decreasing slowly.
Examples Temperature of liquid as it cools. Population of rabbits after a forest fire.
Your Turn Come up with your own stories for the following graphs.
Constant Graphs Definition: As the x value increases, the y value stays the same. Basically, any time the graph flattens out
What would the graph look like for the following story. Sketch it on your paper. Miss Palomaa is on a scavenger hunt! She jumps in her Ford Echo to get away first. She speeds up very quickly, then has to slam on the brakes to turn a corner, she speeds up again only to come to a full stop outside a Starbucks so she can buy some coffee. Fortunately for her the Starbucks cup is also first on her list. Sketch her car’s speed as time passes. Now put it all together…
Classwork…Comic Strips You will choose a comic strip template and then draw a story in the boxes…in the last big box you will draw a graph of what was happening in your story. Make sure you have an independent (x) and dependent variable (y).
Summary The differences between an increasing graph and a decreasing graph are… Class work: Comic Strips Homework: Worksheet 9.4