Download
1 / 1
10 likes | 89 Views
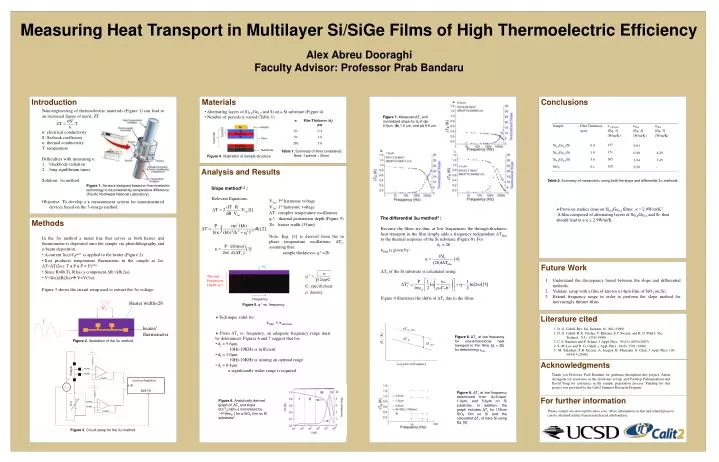
ω c. Δ T Si+ film. Measuring Heat T ransport in Multilayer Si/ SiGe Films of High T hermoelectric E fficiency. Thermal Penetration Depth (q -1 ). Δ T S i. Δ T film. Alex Abreu Dooraghi Faculty Advisor : Professor Prab Bandaru. Frequency. Δ T x (K). Log plot of Frequency.

E N D
ωc ΔT Si+ film Measuring Heat Transport in Multilayer Si/SiGeFilms of High Thermoelectric Efficiency Thermal Penetration Depth (q-1) ΔT Si ΔT film Alex Abreu DooraghiFaculty Advisor: Professor Prab Bandaru Frequency ΔTx(K) Log plot of Frequency • Nanoengineering of thermoelectric materials (Figure 1) can lead to an increased figure of merit, ZT • σ: electrical conductivity • S: Seebeck coefficient • κ: thermal conductivity • T: temperature • Difficulties with measuring κ: • blackbody radiation • long equilibrium times. • Solution: 3ω method • Objective: To develop a κmeasurement system for nanostructured devices based on the 3-omega method. • . Introduction Conclusions Materials a. • Alternating layers of Si0.8Ge0.2 and Si on a Si substrate (Figure 4) • Number of periods is varied (Table 1) Figure 7. Measured ΔTx and normalized slope for df of (a) 0.4μm, (b) 1.0 μm, and (c) 5.6 μm. Au Heater Si 1 period Si0.8Ge0.2 Si n periods Film . . Si0.8Ge0.2 b. Table 1. Summary of films considered. Note: 1 period = 20nm. c. Si wafer Substrate Figure 4. Illustration of sample structure Relevant Equations: Analysis and Results Table 2. Summary of measured κ using both the slope and differential 3ω methods. Figure 1. Sensors designed based on thermoelectric technology to be powered by temperature difference (Pacific Northwest National Laboratory) Slope method1,2 : V3ω: 3rd harmonic voltage V1ω: 1st harmonic voltage ΔT: complex temperature oscillations q-1: thermal penetration depth (Figure 5) 2b: heater width (35μm) Note: Eqs. [3] is derived from the in phase temperature oscillations, ΔTx, assuming that: sample thickness> q-1>2b. Literature cited • Previous studies done on Si0.8Ge0.2 films: κ = 2.9W/m/K5. • A film composed of alternating layers of Si0.8Ge0.2 and Si thus should lead to a κ≤2.9W/m/K. 1. D. G. Cahill, Rev. Sci. Instrum. 61, 802 (1990) 2. D. G. Cahill, H. E. Fischer, T. Klitsner, E.T. Swartz, and R. O. Pohl J. Vac. Technol., 7(3), 1259 (1988) 3. C. E. Raudzis and F. Schatz, J. Appl. Phys., 93(10), 6050 (2003) 4. S.-M. Lee and D. G. Cahill, j. Appl. Phys., 81(6), 2591 (1996) 5. M. Takashiri, T. B. Tasciuc, A. Jacquot, K. Miyazaki, G. Chen, J. Appl. Phys. 100, 054315 (2006) The differential 3ω method4 : Methods • In the 3ω method a metal line that serves as both heater and thermometer is deposited onto the sample via photolithography and e-beam deposition. • A current I(ω)=I0eiωt is applied to the heater (Figure 2). • I(ω) produces temperature fluctuations in the sample at 2ω, ΔT=ΔT(2ω): T α P α I2 = I2ei2ω • Since R=R(T), R has a component ΔR=ΔR(2ω) • V=I(ω)ΔR(2ω)V=V(3ω). • Figure 3 shows the circuit setup used to extract the 3ω voltage. Because the films are thin, at low frequencies the through-thickness heat transport in the film simply adds a frequency independent ΔTfilm to the thermal response of the Si substrate (Figure 8). For df < 2b κfilm is given by: ΔTxof the Si substrate is calculated using: Figure 9 illustrates the shifts of ΔTxdue to the films. Acknowledgments Thank you Professor Prab Bandaru for guidance throughout this project, Anton Arriagada for assistance in the electronic set-up, and Paothep Pichanusakornand David Yang for assistance in the sample preparation process. Funding for this project was provided by the Calit2 Summer Research Program.. Please contact alexdooraghi@yahoo.com. More information on this and related projects can be obtained at http://maeresearch.ucsd.edu/bandaru. For further information Future Work • Understand the discrepancy found between the slope and differential methods. • Validate setup with a film of known κ(4μm film of SiO2 on Si) • Extend frequency range in order to perform the slope method for increasingly thinner films. Heater width=2b Figure 5. q-1vs. frequency V3 • Technique valid for: • κfilm < κsubstrate • From ΔTx vs. frequency, an adequate frequency range must be determined. Figures 6 and 7 suggest that for: • df = 5.6μm • 10Hz-10KHz is sufficient. • df = 1.0μm • 10Hz-10KHz is nearing an optimal range • df= 0.4μm • a significantly wider range is required. I heater/ thermometer Figure 8. ΔTx at low frequency for one-dimensional heat transport in thin films (df < 2b) for determining κfilm Figure 2. Illustration of the 3ω method Sample Lock-in Amplifier A-B REF IN Figure 9. ΔTx at low frequency determined from df=0.4μm, 1.0μm, and 5.6μm on Si substrate. In addition, the graph includes ΔTx for 100nm SiO2 film on Si and the calculated ΔTx of bare Si using Eq. [5]. Pot Figure 6. Analytically derived graph of ΔTx and slope d(ΔTx)/d(lnω) normalized by –P/(lπκsi ) for a SiO2 film on Si substrate3. Figure 3. Circuit setup for the 3ω method