Download
1 / 2
20 likes | 167 Views
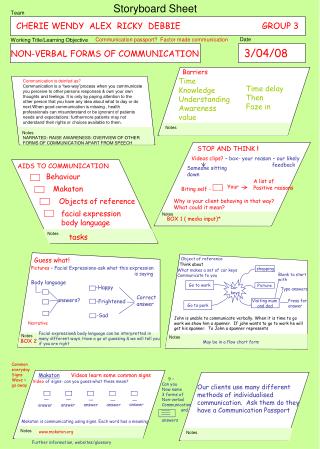
Notes:. This interactive has been adapted from an original worksheet (“The Bus Queue”) by Malcolm Swan as appeared in the Shell Centre publication “The language of functions and graphs”. The adaptation was made by Mark McCourt.

E N D
Notes: This interactive has been adapted from an original worksheet (“The Bus Queue”) by Malcolm Swan as appeared in the Shell Centre publication “The language of functions and graphs”. The adaptation was made by Mark McCourt. The Characters may be moved by clicking and dragging each individual. This allows the student to manipulate the people and compare their heights by placing them alongside each other.
Age Height Who is represented by each point on the scatter graph?