Download

1 / 48
520 likes | 930 Views
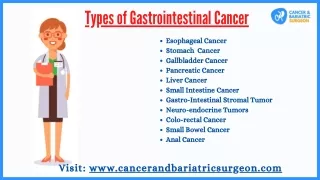
Increasing Role of Precision Medicine in the Treatment of Gastrointestinal Cancer. Axel Grothey West Cancer Center Research Institute U Tennessee. Precision Medicine - Definition.

E N D
Increasing Role of Precision Medicine in the Treatment of Gastrointestinal Cancer Axel Grothey West Cancer Center Research Institute U Tennessee
Precision Medicine - Definition • Medical model that proposes the customization of healthcare, with medical decisions, treatments, practices, or products being tailored to the individual patient • It does not literally mean the creation of drugs or medical devices that are unique to a patient, but rather the ability to classify individuals into subpopulations that differ in their susceptibility to a particular disease • Difference to “personalized medicine”, but de facto both terms are often used interchangeably
What influences treatment choices in mCRC? Patient characteristics Molecular characteristics 1L Prior adjuvant treatment BRAF Comorbidities RAS 2L Performance status 3L HER2 Age MSI-high 4L Patient preference Tumor characteristics Quality of life Toxicity profile Tumorburden Resectability Therapy tailored according to individual patient needs Tumor location
The “Perfect” Candidate for First-Line EGFR mAbs Negative selection (mutually exclusive) • KRAS/ NRAS/ HRAS exon 2, 3, 4 wild-type - 55% • No BRAF V600E mutation - 8% • (No HER-2 amplification -2.5%) Further exclusion criteria (not mutually exclusive) • Right-sided cancers 30%
BRAF Mutations in CRC EGF Tumor Cell • BRAF is primary effector of KRAS signaling • BRAF mutations: • Occur most frequently in exon 15 (V600E) • Found in 4%-14% of patients with CRC • Mutually exclusive with KRAS mutations Ras P P Raf P P MEK Tumor cellproliferation and survival Erk Yarden. Nat Rev Mol Cell Biol. 2001; Di Nicolantonio. J ClinOncol. 2008; Artale. J ClinOncol. 2008.
PETACC-3: Survival after relapse according to BRAF mutation status Median OS: BRAF mut: 7.49 m BRAF wt: 25.2 m (p = 1.9e-11) BRAF mut BRAF wildtype Tejpar et al, ASCO 2010 Roth et al. JCO 2010
Rationale for combined BRAF and EGFR blockade EGFR EGFR RAS BRAFmut MEK ERK 1Hong et al Cancer Disc ‘16
S1406: PFS –Cetux+Irino +/- Vemurafenib 100% N Events Median 95% ConfInt Cetuximab + Irinotecan 50 48 2.0 (1.8 – 2.1) Vemurafenib + Cetuximab 49 40 4.3 (3.6 – 5.7) + Irinotecan 80% 60% HR = 0.48 (95% CI 0.31 – 0.75) P = 0.001 40% 48% cross-over 20% 0% 0 3 6 8 10 12 14 Months after randomization Kopetz et al., ASCO 2017
S1406: RR/OS –Cetux+Irino +/- Vemurafenib 100% 100% Cetuximab + Irinotecan OS (mos) 20% 20% N Median 95% CI Cetuximab + Irinotecan 50 5.9 (3.0 – 9.9) Vemurafenib + Cetuximab 49 9.6 (7.5 – 13.1) + Irinotecan 4% 0% 0% -30% -30% DCR 22% -100% -100% HR = 0.73 (95% CI 0.45 – 1.17) P=0.19 Vemurafenib + Cetuximab + Irinotecan 16% DCR 67% Kopetz et al., ASCO 2017
BEACON CRC Phase 3 Study Design1 Safety Lead-in Completed Phase 3 Currently Enrolling Triplet therapyENCO + BINI + CETUXn=205 Disease progression Continued follow-up for evaluation of OS ENCO 300 mg QD + BINI 45 mg BID + CETUX 400 mg/m2 (initial), then 250 mg/m2 QW Doublet Therapy ENCO + CETUXn=205 Disease progression R 1:1:1 Disease progression Control Arm FOLFIRI + CETUX, orIRI + CETUXn=205 N=30 1. Clinicaltrials.gov/ct2/show/NCT02928224; https://clinicaltrials.gov/ct2/show/NCT02928224 (February 2018). Van Cutsem et al., ESMO GI 2018
Best Percentage Change in Tumor Measurements from Baseline 1 Cetuximab + Irinotecanfrom SWOG S1406 Best % Change from Baseline RR: 48%, PFS 8.0 mos Patients† *Patients with lymph node disease with decreases in short axis dimensions consistent with RECIST 1.1 defined Complete Response. †One patient had no baseline sum of longest diameters and is not presented. 1. Kopetz S, et al. J Clin Oncol. 2017;35:Abstr 3505, with permission. Van Cutsem et al., ESMO GI 2018
BEACON SLI: Overall Survival 100 1-year OS rate: 62% 90 80 70 60 Overall survival (%) 50 • Median OS: Not reached • Data fully mature through 12.6 months 40 30 20 Patients with BRAFV600 mutation (N=29) 10 Censored patients 0 0 3 6 9 12 15 18 Time (mo) Patients at risk 29 28 25 22 18 6 0 Van Cutsem et al., ESMO GI 2018
Prevalence of Non-V600E BRAF mutations in CRC Outcomes data available for 101 pts with non-V600E BRAF mut Jones et al., JCO 2017
Distribution of non-V600E BRAF mutations in mCRC Jones et al., JCO 2017
Distribution of non-V600E BRAF mutations in mCRC Yao et al. Nature 2017 Jones et al., JCO 2017
OS dependent on BRAF mutation mOS for BRAF: V600E 11.4 mos Non-V600E 60.7 mos WT: 43.0 mos Jones et al., JCO 2017
HER-2 Amplification in CRC HER2 overexpression and amplification is seen in a distinct subset ofmCRC • 5.3% HER2 amplification seen in HERACLES Study (screened =836)1 • HER2 amplification enriched in KRAS, NRAS, BRAF, and PIK3CA WTtumors2 1Siena et al. GI ASCO 2015 2Bertotti et al. Cancer Discovery 2011;1:508-523. 2Kuwada et al. Int. J. Cancer: 109, 291–301(2004)
HER-2 Amplification in CRC • Resistance marker for EGFR antibodies • Defines patients who are candidates for HER-2 targeted therapy
HERACLES: Trastuzumab + Lapatinib • Patients histologically diagnosed with metastatic CRC not amenable to surgery • HER2+, KRAS exon 2 WT • Prior fluoropyrimidines, irinotecan, oxaliplatin, cetuximab, or panitumumab; prior bevacizumab, aflibercept or regorafenib allowed but not mandatory • PS 0-1 • Therapy with • Trastuzumab IV 4 mg/kg load and then 2 mg/qw • Lapatinib po 1000 mg/qd PD (Enrolled n=24; evaluable n=23) • Primary endpoint: ORR (RECIST 1.1 with central independent radiological review) • Secondary endpoints: TTP, safety • Translational: HER2 ctDNA in plasma (ddPCR); HER2 ectodomain in serum (ELISA); NGS in tissue and plasma in de novo resistant patients and upon PD Sartore-Bianchi, et al. Lancet Oncol 2016 ddPCR=Droplet Digital PCR; NGS=next-generation sequencing.
HERACLES: Trastuzumab + Lapatinib 60% DCR Primary endpoint met in advance with 8/27 objective responses (as per protocol, 6/27 needed to declare the study positive) Sartore-Bianchi, et al. Lancet Oncol 2016
HERACLES: Responses Sartore-Bianchi, et al. Lancet Oncol 2016
MyPathway: Trastuzumab + Pertuzumab in HER-2 pos CRC N = 31, RR 42% Hurwitz et al., ASCO GI 2017
Mismatch Repair Deficiency (MMR-D):Unique Biological Subgroup of Colon Cancer IHC for MMR protein status MLH1+ MSH2- MLH1- MSH2+ • Thus, IHC for MMR proteins and PCR for MSI detect two manifestations of the same tumor biology: • MMR-D is synonymous with MSI-H • MMR-P is synonymous with MSI-L/MSS PCR on tumor DNA for MSI (microsatellite instability) Imai and Yamamoto. Carcinogenesis 2008 Umetani, Annals of Surgical Oncology 2000 Rosen et al. Modern Pathology (2006) 19, 1414-1420
Hypermutation and Immuno-Oncology • In CRC, MSI-H is associated with increases in immune infiltration and expression of immune checkpoint regulators1,2 • MSI-H is also associated with increased number of mutations per tumor • Tumor mutations produce tumor-specific neoantigens, which when expressed on the tumor cell surface, are a target for T cells • May improve response to immunotherapy • Elevated neoantigen load in CRC is associated with improved survival2 Llosa NJ, et al. Cancer Discov. 2015;5:43–51. Giannakis M, et al. Cell Reports. 2016;15:857–865.
MSI-high CRCs are responsive to PD-1 inhibitors Pembrolizumab(KEYNOTE 016, phase II)1,* Nivolumab ± ipilimumab (CheckMate-142, phase II)2 Nivolumab 3mg/kg +ipilimumab 1mg/kg Nivolumab 3mg/kg 125 100 100 Off treatment Off treatment MMR-proficient CRC 100 Nivolumab + ipilimumab treatment ongoing Nivolumab treatment ongoing 75 75 MMR-deficient CRC 75 1st occurrence of new lesion 50 50 1st occurrence of new lesion CR or PR 50 25 25 % change truncated to 100 CR or PR 25 Change from baseline SLD (%) Change from baseline (%) Change from baseline (%) 0 0 0 365 730 –25 –25 –25 –50 –50 –50 –75 –75 –75 –100 –125 –100 –100 0 6 12 18 24 30 36 42 48 54 60 66 72 78 84 0 6 12 18 24 30 36 42 48 54 60 66 72 78 84 Time (weeks) Time (weeks) % change truncated to 100% 100 100 100 MMR-proficient CRC 75 75 MMR-deficient CRC 50 50 50 56% of patients with reduction 81% of patients with reduction 25 25 Best reduction from baseline in target lesion(%) Best reduction from baseline in target lesion(%) Change from baseline SLD (%) 0 0 0 –25 –25 * * * * –50 –50 –50 * * * * * * * * * –75 –75 * * * * * * * * –100 –100 –100 • *Lynch Syndrome (yes/no/unknown): MMR-deficient CRC = 54/7/39; MMR-proficient CRC = 0/100/0 1. Le et al. ASCO 2016; 2.Overman et al. ASCO 2016
Response of MMR-D/ MSI-H Cancers to Pembrolizumab Monotherapy Le et al., Science 2017
Response of MMR-D/ MSI-H Cancers to Pembrolizumab Monotherapy Le et al., Science 2017
PFS and OS of MMR-D/ MSI-H Cancers on Pembrolizumab Monotherapy PFS OS Le et al., Science 2017
How Common is MSI-H/ MMR-D in Cancer? Analysis of 11,139 tumor-normal pairs from TCGA 39 cancer types MSI-H present in 3.8% overall, 27 tumor types 12 malignancies with no MSI-H (e.g. lymphoma, AML) Bonneville et al., Precis Oncol 2017
NGS Strategies to Assess TMB 1. Meyerson M, Nat Rev Genet. 2010;11(10):685-696. 2. Chalmers ZR, Connelly CF, Genome Med. 2017;9(1):34. 3. Ng SB, Nature. 2009;461(7261):272-276. 4. Warner JL, Genome Med. 2016;8(1):113. 5. Choi M, Proc Natl Acad Sci USA. 2009;106(45):19096-19101. 6.Alexandrov LB, Nature. 2013;500(7463):415-421. 7.Roszik J, BMC Med. 2016;25;14(1):168. 8. Garofalo A, Genome Med. 2016;8(1):79. 9.Nagahashi M, Genome Med. 2016;8(1):136.
Prevalence of Somatic Mutations in Various Cancers Alexandrov et al., Nature 2013
Tumor Mutational Load (TML) in GI Cancers Salem... Grothey Mol Cancer Res 2018
Relationship between key IO-related factors in GI Cancers N=3,896 pts Salem... Grothey Mol Cancer Res 2018
TCGA CRC Mutation Analysis TCGA, Nature 2012
Who, when and how should be tested for MSI/ MMR? • No clear guidelines which test (IHC, PCR, NGS) should be used to identify patients • Should all patients with solid cancers be tested, in view of the fact that frequency of MSI-H/ MMR-D varies between cancers? • When in the treatment sequence should the tests be performed? • Will the results have implications for treatment even in the adjuvant setting? • Could Tumor Mutation Burden (TMB) be an even better marker?
Targeting Tropomyosin Receptor Kinase (TRK) Fusion: Larotrectinib Hyman D, et al. 2017 ASCO. Abstract LBA2501.Drilon A, et al. N Engl J Med. 2018;378:731-739..
Larotrectinib in Cancers with NTRK Fusion • 55 patients enrolled over 2 years • 17 different tumor entities • 33% sarcomas, 22% salivary gland cancers • NTRK1: 45%, NTRK2: 2%, NTRK3: 53% • RR 80% (inv) with 16% CR • No grade 4 toxicity! • Prevalence: less than 0.5-1% of common cancers Drilon et al., NEJM 2018
Larotrectinib in Cancers with NTRK Fusion Drilon et al., NEJM 2018
52 yo female Pt with papillary Thyroid Cancer West Cancer Center, MolTumorboard, Oct 9, 2018
Genetic Landscape of Biliary Cancers ICC ECC ERBB2/3 amplification (11-17%) IDH1/2 mutation (0-7%) PIK3CA mutation (7%) MET mutation (4%) BRAF mutations (3%) MET amplification (1%) FGFR1-3 fusions, mutations & amplifications (11-45%) IDH1/2 mutation (5-36%) RNF43 mutation (9%) PIK3CA mutations (3-9%) BRAF mutations (3-7%) ERBB3 amplification (7%) MET amplification (2-7%) ERBB3 mutation (7%) MET mutation (5%) EGFR mutation (1-2%) GBCA ERBB2/3 amplification (10-19%) PIK3CA mutation (6-13%) BRAF mutation (1-6%) RNF43 mutation (4%) MAP2K4 mutation (4%) EGFR mutation (4%) FGFR1-3 fusions, mutations & amplifications (3%) IDH1/2 mutation (2%)
Frequencies of Actionable Mutations in BTCs Goyal et al., ESMO GI 2017
Phase II: BGJ398 in FGFR altered Cholangiocarcinomas RR: 14.8% SD: 60.7% 2/3 patients with more than 2 linesof prior therapy Javle et al, JCO 2018
Conclusions • Advances in molecular profiling have identified multiple GI cancer subtypes across tumor entities which warrant specific interventions • Tissue/ organ independent drug approvals based on molecular signature are emerging • Who to test, when and how….? • Even common organ cancers are turned into a collection of rare diseases • Challenges for clinical trial design to provide proof of efficacy of novel therapy • Precision Medicine is HERE!
The way forward… “Science is to see what everyone else has seen, but think what no one else has thought.” Albert von Szent-Györgyi Nobel Prize in Physiology or Medicine in 1937