Download
1 / 22
220 likes | 317 Views
Estimating the Numbers of End Users and End User Programmers. Christopher Scaffidi Brad Myers Mary Shaw Carnegie Mellon University EUSES Consortium VL/HCC ’05, Sep 23, 2005. The Old 55M Estimate.

E N D
Estimating the Numbers of End Users and End User Programmers Christopher Scaffidi Brad Myers Mary Shaw Carnegie Mellon University EUSES Consortium VL/HCC ’05, Sep 23, 2005
The Old 55M Estimate • The number of end-user programmersin the U.S. alone is expected to reach 55 millionby2005, as compared to only 2.75 million professional programmers.
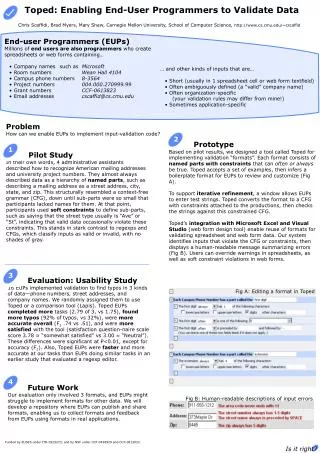
Our New 90M Estimate • The number of usersin U.S. businesses is expected to exceed 90 millionby2012, • including over 55 million users ofspreadsheets and/or databases,as compared to under 3 million professional programmers.
Outline • The Basic 55M Estimation Method • 55M End User Programmers in 2005 • Extending the Method • 90M Users in 2012 • 55M Spreadsheet and/or Database Users in 2012 • Conclusions
History and Purpose of the 55M Estimate • First appeared in COCOMO (circa 1995) • COCOMO is Boehm’s model for estimating the cost of developing software applications • How many people would benefit from COCOMO? • To answer this, Boehm projected… • # of professional programmers (2.75M in 2005) • # of end user programmers (55M in 2005) • .
Step #1: Project Worker Counts for 2005 • Steps to generate the estimate • Get the Bureau of Labor Statistics (BLS) occupation projections for 2005
Step #2: Estimate what Fraction of Workers Use the Computer • Steps to generate the estimate • Get the Bureau of Labor Statistics (BLS) occupation projections for 2005 • Get the BLS computer usage rates by occupation for 1989
Step #3: Multiply and Sum Up • Steps to generate the estimate • Get the Bureau of Labor Statistics (BLS) occupation projections for 2005 • Get the BLS computer usage rates by occupation for 1989 • Multiply worker projections by computer usage rates Sum turns out to be -----> 55 M
Step #4: Apply Adjustments • Steps to generate the estimate • Get the Bureau of Labor Statistics (BLS) occupation projections for 2005 • Get the BLS computer usage rates by occupation for 1989 • Multiply worker projections by computer usage rates • Finally, adjust upward to account for rising usage rates, and adjust downward because not all users are programmers. • Boehm originally relied on judgment to provide adjustments. • The two adjustments actually ended up canceling out!
Our Paper Provides Better Adjustments • Adjustment #1: Rising Usage Rates • Use innovation diffusion to model rising usage rates. • We also extend the estimates to 2012. • Adjustment #2: Not Everybody Programs • Be precise about what aspect of “programming” to address. • We can focus on spreadsheet/database users. • We can focus on users who self-reportedly “do programming.” • Each of these groups vastly outnumbers professionals.
Adjustment #1: Rising Usage Rates • We incorporated additional BLS data • 1984 • 1989 (the only year used in old 55M estimate) • 1993 • 1997
Adjustment #1: Rising Usage Rates • Innovation diffusion theory to the rescue • Innovations diffuse through populations like diseases. • Researchers studied various functional forms for modeling this. • The simplest form (and most generally applicable) is S-shaped
Adjustment #1: Rising Usage Rates • Projecting the computer usage rates • The S-shaped functional form had 3 free parameters (K, m, b) • We have 4 measurements from BLS (1984, 1989, 1993, 1997) • So we can fit to functional form for each occupation category • (Note that with so few points, “goodness of fit” means little.)
Adjustment #1: Rising Usage Rates • Projecting the computer usage rates • The S-shaped functional form had 3 free parameters (K, m, b) • We have 4 measurements from BLS (1984, 1989, 1993, 1997) • So we can fit to functional form for each occupation category • (Note that with so few points, “goodness of fit” means little.) • A somewhat better estimate • Get the BLS’s latest occupation projection (which happens to be for the year 2012) • Plug in t=2012 to forecast future computer usage rates • Multiply and sum as Boehm did • Result: 90M users in 2012
Validation • Does it match 2001 BLS count of workplace users? • BLS modified their questions slightly in 2001 • Our fit predicts 71.9M users; actual = 72.3M • Incorporating this 2001 BLS data into our fit raises our estimate for 2012 from 90M users to 96M users • Does it match 2003 Forrester count? • They found 129M users (work or home) age 18-64 • Our fit predicts 80M workplace users for 2003 • Use BLS 2001 to adjust for age, add in home (non-work) users • Our result for comparison: a little over 123M (to their 129M) • Excellent match.
Examining Assumptions • We replace one assumption for another. • Old assumption: based on judgment • New assumption: applicability of innovation diffusion • Implication of using our assumption • Questionable assumption! Ongoing improvements in computers will probably drive adoption still higher. • Therefore, 90M is probably a lower bound.
Adjustment #2: Not All Users Program • One big count (of all users) isn’t too helpful. • It can only be used to argue, “This sure is big.” • Relative usefulness of a collection of numbers • Not all users have the same needs, strengths, and goals! • How can we break down the estimate into smaller groups, to guide research and development?
Adjustment #2: Not All Users Program • One approach: Group users by application usage. • In 2001, BLS asked how workers use computers. • Total of 72M people used computers at work. • Over 60% of total (45M) used spreadsheets or databases. • About 15% of total (11M) said they “do programming.”
Adjustment #2: Not All Users Program One approach: Group users by application usage. • In 2001, BLS asked how workers use computers. • Total of 72M people used computers at work. • Over 60% of total (45M) used spreadsheets or databases. • About 15% of total (11M) said they “do programming.” • Carrying this forward to yield 2012 lower-bounds... • Total of 90M people will use computers at work. • Over 60% of total (55M) will use spreadsheets or databases. • About 15% of total (13M) will say they “do programming.” • BLS projects only 3M professional programmers. Our Extended Method
Conclusions • New estimates for American workplaces in 2012: • At least 90M users • At least 55M spreadsheet and/or database users • About 13M users will say they “do programming” • Fewer than 3M professional programmers • Our estimates are based on improved adjustments: • Model adoption rates using innovation diffusion theory • Group users according to how they use computers
Thank You • To VL/HCC for the opportunity to present • To NSF, Sloan, and NASA for funding • To Barry Boehm for discussions of his 55M estimate