Download
1 / 10
100 likes | 211 Views
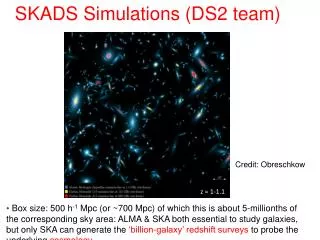
The SKADS sky and databases. F. Levrier, R. Wilman, D. Obreschkow, H.-R. Klöckner, S. Rawlings (Oxford Astrophysics) D. Olteanu, S. Young (Oxford e-Research Center). DS2-T1 MEETING LISBON JANUARY 7, 2008. Output from continuum and line simulations. ASCII files

E N D
The SKADS sky and databases • F. Levrier, R. Wilman, D. Obreschkow, H.-R. Klöckner, S. Rawlings • (Oxford Astrophysics) • D. Olteanu, S. Young • (Oxford e-Research Center) DS2-T1 MEETING LISBON JANUARY 7, 2008
Output from continuum and line simulations • ASCII files • large quantities of data (~45 Gb) Example: continuum simulations - 235,301,766 sources
Data distribution and map making • Query data based on position, source type, flux limit... • Requires database structure (MySQL / PostgreSQL) • Continuum simulations database + HI line simulations database • For each database : source tables + cluster table Example: continuum simulations database Source table Cluster table • Unique source index per substructure • NULL values for Q,U,V fluxes • Max. number of entries per table: 1,000,000
Making the SKADS continuum sky Input map parameters region - source types - resolution - frequency - flux limit Query databases Read structure information position - size - orientation - reference fluxes Build template image Compute flux Scale template image Paste into full map
Making the SKADS HI line sky (I) First approach @ low resolution : synthetic spectra HI flux Synthetic double-peaked shape
Making the SKADS HI line sky (II) Second approach @ high resolution : template cubes from R. Boomsma • Galaxy models made of “clouds” • Placed according to density profile • Orbiting according to velocity curve • 5 galaxy types (spirals and irregulars) • 46 inclination values (0-90 degrees) • 5 asymptotic velocities scale / rotate / paste S0-Sab
Map Maker • Standalone application in Python / IDL • SQL/Python interface • FITS output
Central square degree of the continuum simulations Radio-quiet AGN FR I FR II “Normal” galaxies Starburst
Where we stand, where we’re going • Database implementation • IDL to python conversion of Map Maker • Release of central square degree data in the test phase (~100 Mb) http://webmail.jb.man.ac.uk/skadswiki/ContsimVersion4 • Testing of simulation output (T. Mauch, F. Abdalla, T. Kitching) • Hosting of the database server by OeRC • Implementation of web interface for database and imaging queries • Release of Map Maker • Release of the full simulations • Interface with a MeqTrees sky model
Measurement Set Generator • MeqTrees interfaces with AIPS++ Measurement Sets, but it doesn’t build them from scratch • Local MS generator: python interface to a glish script from T. Willis • Can use existing configurations or generate random ones