Download
1 / 1
10 likes | 87 Views
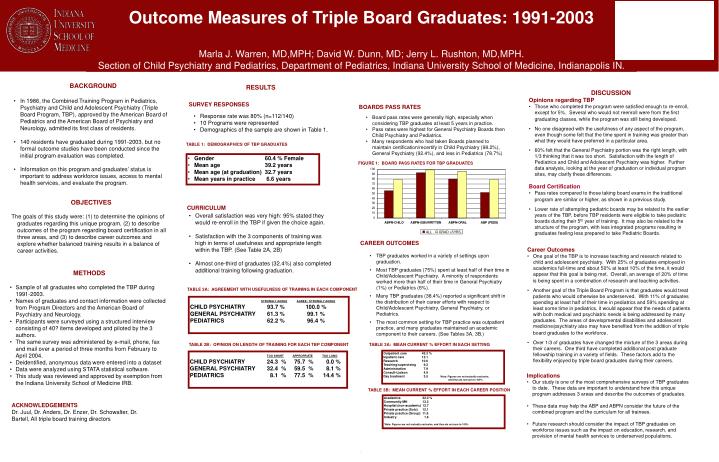
Outcome Measures of Triple Board Graduates: 1991-2003 Marla J. Warren, MD,MPH; David W. Dunn, MD; Jerry L. Rushton, MD,MPH. Section of Child Psychiatry and Pediatrics, Department of Pediatrics, Indiana University School of Medicine, Indianapolis IN. BACKGROUND

E N D
Outcome Measures of Triple Board Graduates: 1991-2003 Marla J. Warren, MD,MPH; David W. Dunn, MD; Jerry L. Rushton, MD,MPH. Section of Child Psychiatry and Pediatrics, Department of Pediatrics, Indiana University School of Medicine, Indianapolis IN. • BACKGROUND • In 1986, the Combined Training Program in Pediatrics, Psychiatry and Child and Adolescent Psychiatry (Triple Board Program, TBP), approved by the American Board of Pediatrics and the American Board of Psychiatry and Neurology, admitted its first class of residents. • 140 residents have graduated during 1991-2003, but no formal outcome studies have been conducted since the initial program evaluation was completed. • Information on this program and graduates’ status is important to address workforce issues, access to mental health services, and evaluate the program. RESULTS • DISCUSSION • Opinions regarding TBP • Those who completed the program were satisfied enough to re-enroll, except for 5%. Several who would not reenroll were from the first graduating classes, while the program was still being developed. • No one disagreed with the usefulness of any aspect of the program, even though some felt that the time spent in training was greater than what they would have preferred in a particular area. • 60% felt that the General Psychiatry portion was the right length, with 1/3 thinking that it was too short. Satisfaction with the length of Pediatrics and Child and Adolescent Psychiatry was higher. Further data analysis, looking at the year of graduation or individual program sites, may clarify these differences. • Board Certification • Pass rates compared to those taking board exams in the traditional program are similar or higher, as shown in a previous study. • Lower rate of attempting pediatric boards may be related to the earlier years of the TBP, before TBP residents were eligible to take pediatric boards during their 5th year of training. It may also be related to the structure of the program, with less integrated programs resulting in graduates feeling less prepared to take Pediatric Boards. SURVEY RESPONSES BOARDS PASS RATES • Response rate was 80% (n=112/140) • 10 Programs were represented • Demographics of the sample are shown in Table 1. • Board pass rates were generally high, especially when considering TBP graduates at least 5 years in practice. • Pass rates were highest for General Psychiatry Boards then Child Psychiatry and Pediatrics. • Many respondents who had taken Boards planned to maintain certification/recertify in Child Psychiatry (98.2%), General Psychiatry (92.4%), and less in Pediatrics (78.7%) TABLE 1: DEMOGRAPHICS OF TBP GRADUATES • Gender 60.4 % Female • Mean age 39.2 years • Mean age (at graduation) 32.7 years • Mean years in practice 6.6 years FIGURE 1: BOARD PASS RATES FOR TBP GRADUATES OBJECTIVES The goals of this study were: (1) to determine the opinions of graduates regarding this unique program, (2) to describe outcomes of the program regarding board certification in all three areas, and (3) to describe career outcomes and explore whether balanced training results in a balance of career activities. CURRICULUM • Overall satisfaction was very high: 95% stated they would re-enroll in the TBP if given the choice again. • Satisfaction with the 3 components of training was high in terms of usefulness and appropriate length within the TBP. (See Table 2A, 2B) • Almost one-third of graduates (32.4%) also completed additional training following graduation. CAREER OUTCOMES • Career Outcomes • One goal of the TBP is to increase teaching and research related to child and adolescent psychiatry. With 25% of graduates employed in academics full-time and about 50% at least 10% of the time, it would appear that this goal is being met. Overall, an average of 20% of time is being spent in a combination of research and teaching activities. • Another goal of the Triple Board Program is that graduates would treat patients who would otherwise be underserved. With 11% of graduates spending at least half of their time in pediatrics and 59% spending at least some time in pediatrics, it would appear that the needs of patients with both medical and psychiatric needs is being addressed by many graduates. The areas of developmental disabilities and adolescent medicine/psychiatry also may have benefited from the addition of triple board graduates to the workforce. • Over 1/3 of graduates have changed the mixture of the 3 areas during their careers. One third have completed additional post graduate fellowship training in a variety of fields. These factors add to the flexibility enjoyed by triple board graduates during their careers. • TBP graduates worked in a variety of settings upon graduation. • Most TBP graduates (75%) spent at least half of their time in Child/Adolescent Psychiatry. A minority of respondents worked more than half of their time in General Psychiatry (1%) or Pediatrics (6%). • Many TBP graduates (38.4%) reported a significant shift in the distribution of their career efforts with respect to Child/Adolescent Psychiatry, General Psychiatry, or Pediatrics. • The most common setting for TBP practice was outpatient practice, and many graduates maintained an academic component to their careers. (See Tables 3A, 3B.) • METHODS • Sample of all graduates who completed the TBP during 1991-2003. • Names of graduates and contact information were collected from Program Directors and the American Board of Psychiatry and Neurology. • Participants were surveyed using a structured interview consisting of 40? items developed and piloted by the 3 authors. • The same survey was administered by e-mail, phone, fax and mail over a period of three months from February to April 2004. • Deidentified, anonymous data were entered into a dataset • Data were analyzed using STATA statistical software. • This study was reviewed and approved by exemption from the Indiana University School of Medicine IRB. TABLE 2A: AGREEMENT WITH USEFULNESS OF TRAINING IN EACH COMPONENT STRONGLY AGREEAGREE / STRONGLY AGREE CHILD PSYCHIATRY 93.7 % 100.0 % GENERAL PSYCHIATRY 61.3 % 99.1 % PEDIATRICS 62.2 % 96.4 % TABLE 2B: OPINION ON LENGTH OF TRAINING FOR EACH TBP COMPONENT TABLE 3A: MEAN CURRENT % EFFORT IN EACH SETTING Outpatient care 45.3 % Inpatient care 12.1 Research 10.6 Teaching/supervising 9.2 Administration 7.9 Consult-Liaison 4.9 Day treatment 3.5 *Note: Figures are not mutually exclusive, and thus do not sum to 100% TOO SHORTAPPROPRIATETOO LONG CHILD PSYCHIATRY 24.3 % 75.7 % 0.0 % GENERAL PSYCHIATRY 32.4 % 59.5 % 8.1 % PEDIATRICS 8.1 % 77.5 % 14.4 % • Implications • Our study is one of the most comprehensive surveys of TBP graduates to date. These data are important to understand how this unique program addresses 3 areas and describe the outcomes of graduates. • These data may help the ABP and ABPN consider the future of the combined program and the curriculum for all trainees. • Future research should consider the impact of TBP graduates on workforce issues such as the impact on education, research, and provision of mental health services to underserved populations. TABLE 3B: MEAN CURRENT % EFFORT IN EACH CAREER POSITION Academics 32.3 % Community MH 13.3 Hospital (non-academic) 12.7 Private practice (Solo) 12.1 Private practice (Group) 11.9 Industry 1.6 *Note: Figures are not mutually exclusive, and thus do not sum to 100% ACKNOWLEDGEMENTS Dr. Juul, Dr. Anders, Dr. Enzer, Dr. Schowalter, Dr. Bartell, All triple board training directors • .