Download
1 / 22
220 likes | 305 Views
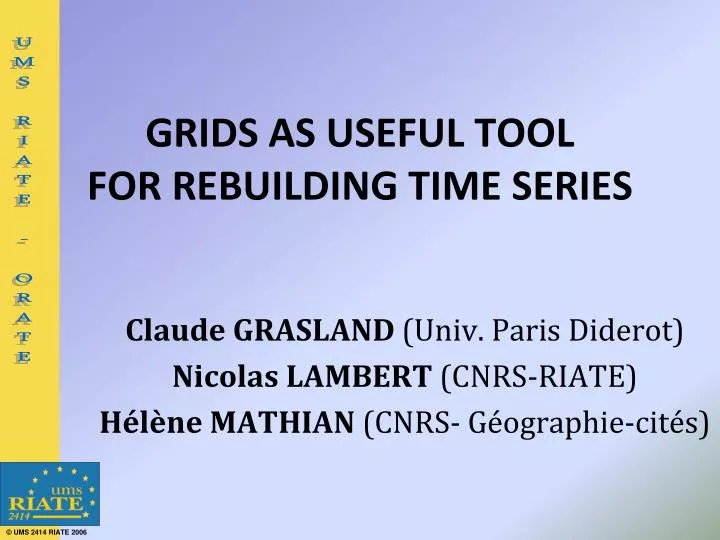
GRIDS AS USEFUL TOOL FOR REBUILDING TIME SERIES. Claude GRASLAND (Univ. Paris Diderot) Nicolas LAMBERT (CNRS-RIATE) Hélène MATHIAN (CNRS- Géographie-cités). SPECIFIC PROBLEM. HOW IS IT POSSIBLE TO ANALYZE EVOLUTIONS WHEN TERRITORIAL DIVISIONS ARE CHANGING ?. GENERAL PROBLEM. GEOM1.

E N D
GRIDS AS USEFUL TOOLFOR REBUILDING TIME SERIES Claude GRASLAND (Univ. Paris Diderot) Nicolas LAMBERT (CNRS-RIATE) Hélène MATHIAN (CNRS- Géographie-cités)
SPECIFIC PROBLEM HOW IS IT POSSIBLE TO ANALYZE EVOLUTIONS WHEN TERRITORIAL DIVISIONS ARE CHANGING ?
GENERAL PROBLEM GEOM1 GEOM1 x GEOM2 GEOM2 HOW IS IT POSSIBLE TO COMBINE DATA AVAILABLE ON TWO DIFFERENT GEOMETRIES ?
SOLUTION n°1 : TRANSFER DATA BY GRID SOLUTION V1_GRID GEOM1xV1 Auxilliary attribute GRID GEOM2xV2
SOLUTION n°2 : GRIDDING + SMOOTHING V1_GRID GEOM1xV1 POT_V1 Ancillary variable GRID POT_V2 / POT_V1 V2_GRID GEOM2xV2 POT_V2
OBJECTIVE : Annual growth rate of population 1990-2006 GEOM1 55 Arrondissements GEOM2 52 Zones d’emploi ??? ???
AN EXACT BUT NOT INTERESTING SOLUTION : Aggregation at first common level
Grid of population 1km x 1km From EEA ANCILLARY VARIABLE 100 000 Grid points
ESTIMATION OF TARGET INDICATOR POP90 / ARRD POP90 /GRID POT (POP90) Gauss 20 km POP00/GRID ANNUAL GROWTH RATE 1990-2006 Gauss 20 km POP06 / ZEMP POP06/ GRID POT (POP06) Gauss 20 km
ESTIMATION OF RESIDUAL « NOISE » POP06 / ARRD POP06/GRID* POT (POP06)* Gauss 20 km POP00/GRID POT(POP06) * ____________ POT (POPO6) POP06 / ZEMP POP06/GRID POT (POP06) Gauss 20 km
Smooth 10 km GOOD SPATIAL RESOLUTION … … BUT HIGH LEVEL OF NOISE Increase of population 1990 - 2006 Noise introduced by the method (%) 0 0.25 0.5 0.75 1.0 -5% -1% +1% +5%
Smooth 40 km LOW SPATIAL RESOLUTION … … BUT LOW LEVEL OF NOISE Increase of population 1990 - 2006 Noise introduced by the method (%) 0 0.25 0.5 0.75 1.0 -5% -1% +1% +5%
Smooth 20 km GOOD COMPROMISE BETWEEN SPATIAL RESOLUTION AND NOISE Increase of population 1990 - 2006 Noise introduced by the method (%) 0 0.25 0.5 0.75 1.0 -5% -1% +1% +5%
SYNTHESIS : Signal & Noise Max Noise < 5% Mean Noise < 1% Gaussian Smooth > 22 km
Smooth + Grid CONCLUSION & PERSPECTIVES
Thank you for your attention ! Grasland, Mathian, Vincent, 2000, Statistical Journal of UN-ECE Grasland, Madelin, 2007, ESPON 3.4.3, MAUP