Download

1 / 75
780 likes | 899 Views
Financing. David Levinson. Financing c. 1920. Financing c. 1996. Federal Highway Revenue by User Class. Freight Movement (Share of Ton-km). Federal Transportation Budget. Transportation Revenues and Revenue Raising Instruments by Mode: FY 1999. Public-Private Partnerships.

E N D
Financing David Levinson
Transportation Revenues and Revenue Raising Instruments by Mode: FY 1999
Public-Private Partnerships • Rising infrastructure costs and social demands => tight government budgets and public resistance (tax increases) • Mutually agreed: government agencies and private business • Private sectors fulfilling responsibilities
PPP Types and Model • Main Types of PPP (USGAO, 1999) • Build-Own-Operate (BOO) • Build-Opeate-Transfer (BOT) • Buy-Build-Operate (BBO) • Design-Build-Operate (DBO) • Build-Develop-Operate (BDO) • Similarities (European) • Design-Build-Finance-Maintain (DBFM, The Netherlands Case) • Design-Build-Finance-Operate (DBFO, Ireland)
USA PPP Experience • The United States: Large PPP projects in the road sector • Alameda Corridor (Long Beach-Los Angeles, CA) • Dulles Greenway, Virginia • State Route 125 South Tollway (San Diego County, CA): 4 lane 11.2 mile highway • Western Loop (Richmond, Virginia) • Route 3 (Massachusetts) • Highway E-470 (Aurora, Colorado): 47 mile toll road
Alameda Corridor • Alameda Corridor (Long Beach-Los Angeles, CA) • History: • Ports Advisory Committee (October 1981) • Route Alternatives (1984) • Alameda Corridor Transport Authority (1989) • The US DOT: $ 400 M, 30 year loan (1998) • Objectives: • Reduce Highway traffic delays • Increase Rail productivity • Reduce Accidents • Improve Air quality
Alameda Corridor • Related Projects: • San Gabriel Valley: 55 rail crossings, LA County, 8 year project, $ 912 M • Pacific Coast Highway Separate Grade (PCH): 30,000 commuters daily, 1 mile long • Discussion: • Completion on time and on budget • Design-Build instead of Design-Bid-Build • Creation of 700,000 jobs (2020, port growth) • Environmental benefits: truck traffic (23% reduction), delays at grade crossings (90% reduction), noise and vibrations (90% reduction)
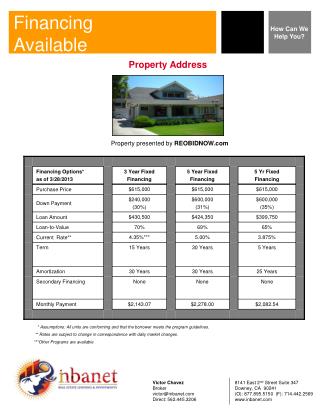
Dulles Greenway, Virginia History: • Originated 1988: Virginia Assembly authorized private toll roads • Construction initiated in 1993 and concluded in 1995 • Consists: 7 interchanges, 36 bridges, a toll plaza, 12 ramp toll barriers, 4 operational lanes. • Extension: 14-mile western extension, Dulles Toll road.
Financing & Regulation • The Case of Spring Load Restrictions. • Current: Truck weights restricted during spring thaw • Alternative: Trucks allowed but charged for the damages imposed.
How Much Revenue? • The revenue required to compensate road owners for the additional damage associated with lifting the SLR in Minnesota can be estimated.
Estimate of Statewide Annual Cost • The annualized cost of a net present value of $127,457,204 at 3.5% interest over 42.5 years is therefore $5,806,768. • Different assumptions will yield different annualized costs.
Diesel Fuel Surcharge • Presently the tax on diesel fuel is $0.20/gallon • In total, 652,549,000 gallons of “Special fuels” were consumed in Minnesota in 2002 • This implies to cover the costs of removing the SLR on 7 and 9-ton roads, a year-round $0.01/gallon diesel fuel surcharge would be sufficient
Annual Fee • There were 34,729 truck/tractors and 48,938 farm trucks in Minnesota in 2002 • Allocating the cost uniformly to all truck/tractors and farm trucks would give a charge of $69.40 per farm truck and truck/tractor vehicle per year to recover the additional damage to roads associated with lifting the SLR on 5 and 7-ton roads.
Weight Distance Tax • In 1999, Oregon voters passed Measure 76, and placed in the state constitution the idea of “cost responsibility”, ensuring that cars and trucks each pay their fair share. • The Oregon Highway Cost Allocation Study is conducted biennially to support highway-financing decisions. • The 2003 report states that light vehicles (weighing 3,636 kg (8,000 pounds) or less) should pay 66.6% of state highway user revenue, and heavy vehicles should pay the remaining 33.4%. • Employing a weight-distance tax in Minnesota would require a change in revenue policy well beyond what is required to recover costs from the Spring Load Restrictions, but remains a good idea to maximize both fairness and efficiency in the highway financing system.
Permitting System • A new SLR permitting system would require a new regulatory apparatus. • Though it would be possible in principle to charge directly based on use, the enforcement required to do so would entail a significant transactions cost that may obviate the gains from policy change.
How Should the Revenue Be Spent? • Because most of the economic burden associated with lifting the Spring Load Restriction would be borne by local governments (counties and municipalities), the revenue that is collected to recover the costs of the additional pavement damage associated with lifting the SLR should be dedicated to local governments to spend on maintaining and rebuilding roads. Local governments would then need to prioritize projects based on local engineering and other information.
Discussion (1) • The highway system has a disjoint control of trucks (owned by trucking firms) and pavements (owned by governmental road agencies), which has created a number of extra costs that proper management of the system might avoid. • Pavements are rated for different loads of trucks; roads are restricted to 5-ton, 7-ton, 9-ton, and 10-ton axle weight trucks. • Shipments across this network are constrained by the lowest weight limit permitted on the roads to be used (or risk violation – though weight enforcement off the interstate highways is very sparse). • Some roads should be upgraded, some trucks should have more axles, but the disjoint nature of the control makes this coordination difficult.
Discussion (2) • The first solution to these problems lies in rethinking highway financing. The ability to charge truckers different amounts for different roads would put the proper incentives for socially beneficial behavior back in the system • A second solution, to improve materials to the point that they are “too cheap to meter”, that is so that they are sufficiently strong that it doesn’t matter the load using them (within reason), is the analog to building your way out of congestion. Laying pavements with near zero variable (per use) costs may be technically possibly, but their upfront fixed (one time) costs are likely to be very high.
Models David Levinson
All forecasts are wrong, some forecasts are more wrong than others.
Rise of the Automobile/ Highway System • Do cars and cities mix? • Can new highways (expressways, freeways) be used to reshape cities? • Original interstate plan proposed to bypass city centers. Cities demanded connection. • Some argued highways would help recentralize cities (e.g. Regional Plan for New York), Other argued highways could be force for decentralization into Garden Cities (e.g. Regional Planning Association of America)
History of Transportation Models • The Chicago Area Transportation Study (1955) (Led by J. Douglas Carroll) • The study cost $3.5 million and took seven years to complete. • Considered • “the foundational study of urban transportation planning in America” (MacDonald 1988; Weiner 1987) • a model of "rational planning" model (Black 1990).
Detroit Metropolitan Area Transportation Study (1953-1955) (Under J. Douglas Carroll). Mostly done by hand. Chicago Area Transportation Study (1955) Washington Area Traffic Study (1955) Baltimore Transportation Study (1957) Pittsburgh Area Transportation Study (1958) Hartford Area Traffic Study (1958) Penn-Jersey Transportation Study (1959) FHWA Planpac Mainframe Model (1960s) UMTA Urban Transportation Planning System Mainframe Model (1960s) Merger of two models to UTPS in 1970s PC implementation (Tranplan, MinUTP, Emme/2, QRSII, Tmodel,Transcad, System2) in 1980s Before and After
CATS • Agency of City of Chicago, Cook County, State of Illinois, and US Bureau of Public Roads • Created in 1955 to analyze travel behavior, forecast future needs, and develop long range plan. • In peak year (1956) employed 369 people, including planners and engineers. • Followed principles of rational planning • Used quantitative methods to establish “technical expertise” • Developed first computer-based regional models
Rational Planning Model • Identify needs • Set objectives • Develop options • Evaluate options • Select best option • Implement policy • Evaluate outcome
Critique of rational planning • Top-down (Newtonian model) • Identical people/groups (aggregation) • No externalities • No dynamics, everything in equilibrium • Everything is “objective” • Missing feedbacks • Others <_______>
CATS Goal: To secure a transportation system for the Chicago area which will reduce travel frictions within the constraints of safety, economy, and the desirable development of land" • Objectives: • increasing speed, • increasing safety, • lowering operating costs, • economizing on new construction, • minimizing disruption, and • promoting better land development.
CATS Input Data: travel, land use, networks desire lines vehicle counts origin-destination surveys home interview surveys CATS Forecasted population, population distribution, per capita income, auto ownership, travel behavior Inputs and Outputs
Questions Did desire lines reflect desires? Is past behavior reflective of future behavior? Can the future be predicted Is the future independent of decisions, or are prophesies self-fulfilling? How do we know if forecasts were successful? Against what standard are they to be judged? What values are embedded in the planning process? What happens when values change?
Purposes of Modeling • Estimation in the absence of data • Forecasting • Scenario Testing (alternative land uses, networks, policies) • Project Planning/Corridor Studies • Growth Management/Development Regulation/Public Facility Adequacy • Manage Complexity, when eyeballs are insufficient, different people have different intuitions • Understanding travel behavior • Influence Decisions
Outputs from Models • Flows on links, • Speeds on links • Origin Destination pattern • Mode Split Other desired outputs • Emissions (requires post-processor, knowledge of fleet composition, dynamics of speeds) • Time of day splits • Change in land use as a result of network
Modeling Process • Specification • Estimation • Implementation • Calibration • Validation • Application • Each step feeds back to previous steps.
Network Framework • zone centroids - special node, number of a zone, identified by x y coordinate • nodes number identified by X Y coordinate • links, indexed by from and to nodes (including centroid connnectors) • turns, indexed by at, from, and to nodes • routes, indexed by a series of nodes (e.g. a bus route) • paths, indexed by a series of nodes from origin to destination. • modes – vehicle lines, transit lines.
Matrices • Indexed by Traffic Analysis Zones (including External Stations) • 4 types: • scalar, • vector (origin), • vector (destination), • full (interaction)
Scalar Matrix • Scalar • For example: ms01 price of fuel ($ per gallon) • ms01 = 1.37
Origin (i), Example ms01= Households per zone Matrix Vector: Origin
Matrix Vector: Destination • Destination (j) • Example Jobs per zone
Matrix: Full • Combine Origin and Destination matrices • For instance Zone to Zone Trips (Trip Table)
Purpose • Trips are "produced" at an origin and "attracted" to a destination. Trips are categorized by Purposes, the activity undertaken at a destination location • Typical purposes are • Home • Work • Shop • School • Eat Out, • Social/Recreational • Medical • Banking • Other • Often categories are dropped and lumped into the catchall Other
Politics of Modeling • Try to be neutral arbiter to maintain credibility for future applications • Influence is maximized when the only game in town ... try to avoid dueling models • Modeling is a process not a project, responses must be timely, which requires having the model set up to answer questions, not setting it up after the question is asked • Spin your own results, don't just dump numbers on someone's lap, give the interpretation yourself. • Only model when necessary, avoid the problem that if your only tool is a hammer everything looks like a nail.
Future of Modeling • Transsims - activity based ... follow individuals rather than aggregates • Uses simulation and stochastic distributions • Problems • Data needs are huge • computation intensity • Complexity • Accuracy • Still no good answer for trip distribution (which requires job matching to be disaggregate) • Modeling imperfect information, especially routing • Integration of components • Land-use transportation models
Land Use Models • Objective: To predict where new land uses will occur, their density, number of units, etc. • Land Use = f (Accessibility - from travel demand model, other things)
The Seven Deadly Sins of Models (Lee’s ‘Requiem’) 1) Hypercomprehensiveness: Meaning that the models tried to replicate too complex a system in a single shot, and were expected to serve too many different purposes at the same time. 2) Grossness: In a way, the converse of hypercomprehensiveness. Even though they tried to do too much and serve too many purposes, their results or outputs were too coarse and aggregate, too simplistic to be useful for complicated and sophisticated policy requirements. 3) Data Hungriness: Even to produce, gross outputs (a few variables), the models required us to input many variables for many geographic units, and from at least several time periods in order to produce approximate projections, and very often we could not afford the data collection efforts needed to run the models. In other instances, data simply didn't exist at the levels of specificity which would be appropriate to run them. 4) Wrongheadedness: Lee meant that the models suffered from substantial and largely unrecognized deviations between the behavior claimed for them and the variables and equations which actually determined their behavior. As an example, when regional averages were used to calibrate models, but forecasts were made for local areas, the models deviated from reality because of specification errors which were often not even recognized by their users.
Seven Deadly Sins (continued) 5) Complicatedness: Even though when you looked at them through one set of lenses the models seemed terribly simplistic, when looked at through another set of lenses they were outrageously complex. Too simplistic in replicating urban economic and social processes, the models were too complex in their computational algorithms. Errors were multiplied because there were so many equations, spatial units, and time periods. Even the theoretical notion of the model or its representation of an urban process was grossly simplistic compared with reality. Often, the user didn't know how the errors were propagated through series of sequential operations; and sometimes we needed to use systematic adjustments or "correction factors" to make the models more realistic even though we did not completely comprehend the sources of all the errors and could not interpret the correction factors in real-world terms. 6) Mechanicalness: Lee meant that we routinely went through many steps in a modeling process without completely understanding why we did so, and without fully comprehending the consequences in terms of validity or error magnification. He stated, for example, that even rounding errors could be compounded beyond reasonable bounds by mechanical steps taken to calibrate and apply many models without the user's knowledge. 7) Expensiveness: The costs of the models, derived from their grossness, data hungriness, complicatedness, and so on, placed them beyond the financial means of many agencies, or depleted the resources of agencies so much that the very use of models precluded having the resources available to improve them or to fine tune them to make them appropriate to their applications.