Download
1 / 12
120 likes | 304 Views
Visual Computing. Art of Stock Market. G7 Stock Puppets Jim Mason www.stockpuppets.com. Internet-driven kinetic installation that tracks the global stock markets with 7 marionette puppets. Puppets rise and fall with the movements of the G-7 market indices. Each Puppet:

E N D
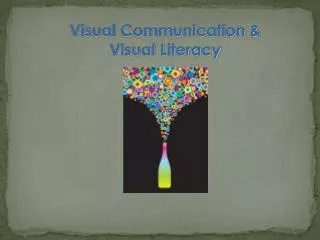
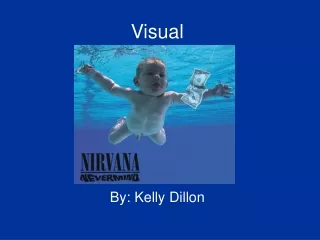
Visual Computing Art of Stock Market
G7 Stock PuppetsJim Masonwww.stockpuppets.com • Internet-driven kinetic installation that tracks the global stock markets with 7 marionette puppets. • Puppets rise and fall with the movements of the G-7 market indices. • Each Puppet: • 8 foot tall fiberglass mannequins in gray-pinstriped suits. • Monitor for a head that streams market data. • Movement cues face animation of a finance minister - the face morphing in relation to the direction of market movement. • Puppet elevated and articulated by cables extending down from pulleys supported 25' overheard on a towers. • Ambient sound of buy and sell orders, bells and gavels
eBay Landscape Carlo Zannihttp://www.zanni.org/ebaylandscape/ebayinfo.html "e-bay landscape" is an online environment based on concepts such as -contemporary identity- (IP presence) and -data lanscape- (ebay stock quote) that, even if invisible, they radically influence our daily life. - Zanni
Mountains are generated grabbing eBay.com stock markets charts. • Mountain shape changes daily (at NASDAQ close) • Charts are cut away from all those elements describing the status of the market, e.g. grids, numbers, and other symbols. • Foreground bamboo trees and other plants are cut from an image from the CNN.com home page. • Bamboo shape changes as many times as CNN.com updates its website (with breaking news and so on - social behavior generates the content of the trees). • The sky fading loop is generated from the IP addresses of the connected user • A script takes the last 3 numbers of each IP to generate a color following the RGB (red-green-blue) scheme and in cycles them, changing colors each time a user joins or leaves the network.
BLACK SHOALS STOCK MARKET PLANETARIUMList Autogena and Joshua PortwayThomas Riley & Cefn Hoile http://www.blackshoals.net/description.html Animated night sky that is also a live representation of the world’s stock markets, with each star representing a traded company.
Animated night sky that is also a live representation of the world’s stock markets, with each star representing a traded company. • Fed by massive streams of live financial information, the stars glimmer and pulse, immediately flickering brighter whenever their stock is traded anywhere in the world. • The stars slowly move across the sky, clustering together or drifting apart in response to the shifting affinities of their respective companies, growing or shrinking as the company’s fortunes change. • Digital creatures, a form of artificial life, inhabit this world, feeding on the light released by the stars, breeding, dying and slowly evolving – while trying to learn to live in this strange artificial ecology into which they’ve been born. • Originally designed to be installed in a restaurant next door to the London Stock Exchange. • Traders would be able to eat underneath the dome – that it would be a kind of ironic “Mount Olympus” from which they would be able to look down and oversee their creation during their lunch time.
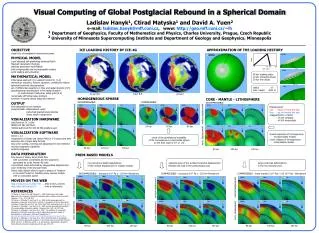
High Altitude Michael Najjarhttp://www.michaelnajjar.com/ NASDAQ – 1980 to 2009 Visualization of Global Stock Markets over past 20 yrs