Download
1 / 30
300 likes | 427 Views
Using the Air Quality Index In Emergency Events Such As Fires. CARPA Summit October 15-16 2008 Sacramento CA Susan Lyon Stone US EPA Human Studies Division stone.susan@epa.gov. Air Quality Index (AQI). Daily information about air quality and health risks, if any

E N D
Using the Air Quality Index In Emergency Events Such As Fires CARPA Summit October 15-16 2008 Sacramento CA Susan Lyon Stone US EPA Human Studies Division stone.susan@epa.gov
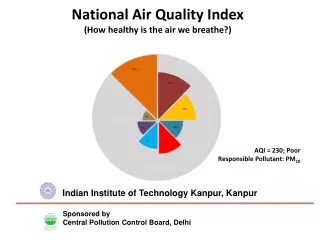
Air Quality Index (AQI) • Daily information about air quality and health risks, if any • Normalized scale (0 – 500), the higher the value the greater the health risk • Four common pollutants: O3; PM; SO2 and CO • Based on the health information from the review of the national ambient air quality standards (NAAQS) • Available through national and local media
Health Effects Assessment • Types of studies • Epidemiology/Field • Real-world exposures, including sensitive groups • Serious and chronic effects assessed • Confounders not controlled • Controlled human exposure • Exposures and confounders controlled • Healthy subjects; few members of sensitive groups • Animal • Exposures and confounders controlled • Extrapolation to humans; high dose exposures • Consistency and coherence of data
“Pyramid of Effects” • Consistent and coherent effects seen across a wide range of health outcomes • Sensitive groups for PM include: • People with heart or lung disease • Older adults • Children Adversity of Effects Proportion of Population Affected
Human Lung • Air conducting • Trachea • Bronchi • Bronchiole • Gas exchange • Respiratory bronchiole • Alveoli
Particulate Matter Affects the Lungs • You are exposed to particles simply by breathing polluted air • Exposure increases when you exercise, because you breathe more vigorously and deeply than usual • Respiratory effects include: • Airway irritation • Cough • Phlegm • Decreased lung function • Airway inflammation • Asthma attacks • Bronchitis and chronic bronchitis
And Particulate Matter Affects the Heart • Particles have been linked to changes that indicate your heart isn’t as healthy as it should be. These include: • Arrhythmias and changes in heart rate • Changes in the variability of your heart rate • Blood component changes • C-reactive protein • Fibrinogen • Plasma viscosity • Changes in vascular endothelial function • Studies indicate that particle exposure can cause heart attacks • Particles are linked with death from heart disease Particle exposure can cause heart attacks.
It’s a Public Health Concern • When particles aggravate heart and lung diseases that means increases in: • Hospital admissions • Doctor and emergency room visits • Medication use • Absences from work or school • Particulate matter is linked to significant public health risks –including premature deathfrom heart and lung disease. • Sensitive groups include: people with heart or lung disease, older adults, children
150 * 100 PMNs (x10,000) * * 50 0 206.7 2.9 47.2 107.8 4 Average CAPS Concentration (m/m3) Air CAPS 3 Ratio CAPS / Pre 2 * 1 * 0 SDNN PNN50 LF HF Total Ratio PM Can Cause Effects in Healthy People Ghio et al., 2003 Devlin et al., 2003
Air Quality Index NAAQS
Use AQI to Reduce Risk Dose = Concentration x Ventilation Rate x Time • Reduce these factors to reduce dose • Pay attention to symptoms • People with asthma – follow asthma action plan • Coaches – rotate players frequently • People with heart disease • Check with your doctor • Don’t exercise near busy roads
Revised July 2008 • Multi-agency collaboration • CA Department of Public Health • Office of Environmental Health Hazard Assessment • Air Resources Board • Missoula County Department of Health • US Environmental Protection Agency
Sections on: Composition and characteristics of smoke Health Effects and sensitive populations Strategies to reduce exposure Estimating PM levels Recommendations for public health actions
Strategies for Reducing Exposure • Stay indoors • Reduce activity • Indoor air • Reducing indoor sources of pollution • Using air conditioners and room air cleaners • Creating a clean room • Avoiding ozone generators • Using humidifiers • Inside vehicles • Respiratory protection • Cleaner air shelters • Closures • Evacuation
New section on use of disposable respirators – from California DPH • These should not be used to increase time outdoors • Includes instructions on mask choice and use • Fact sheet for dissemination
Recommended Actions for Public Health Officials • Based on AQI values • With 3 different averaging times (i.e.,1- to 3-hour, 8- hour, and 24-hour) • Actions include: • Public service announcements • Identifying cleaner air shelters • Closing schools and cancelling outdoor events • Evacuation • Other considerations include: • Fluctuations in PM2.5 levels • Predicted duration of high PM2.5 levels • Potential indirect effects
The journey begins….. 9:59:59 10:00:01
First stop: AQ Agency 89 34 START_REF, 0 NUMSTEPS, 24 AVG_TIME, 60 UNITS, PPB STATIONS, 1342 ! START HOUR ! ID AIRS CODE 0000 0100 0200 0300 0400 0500 0600 !------------------- --------- ---- ---- ---- ---- ---- ---- ---- ---- ---- ---- ---- BEGIN_DATA ST. J ,000010102, 5, 12, 7, 3, 2, 2, 7, 6, 9, 5, 6 ST. J ,000010102, G, G, G, G, G, G, G, G, G, G Corne ,000010301, 13, 13, 10, 6, 5, 7, 14, 16, 18, 22 Corne ,000010301, G, G, G, G, G, G, G, G, G, WELLI ,000020301,-999,-999,-999,-999,-999,-999,-999,-999 76 OBS data file 67 39 • Stats: • 1200 monitors • 78 agencies nationwide • Collected every hour 101 10:15:21 10:05:29
Stats: Redundant computer servers Files processed in seconds Over 30,000 data values per day 50 maps produced every hour START_REF, 0 NUMSTEPS, 24 AVG_TIME, 60 UNITS, PPB STATIONS, 1342 ! START HOUR ! ID AIRS CODE 0000 0100 0200 0300 0400 0500 0600 !------------------- --------- ---- ---- ---- ---- ---- ---- ---- ---- ---- ---- ---- BEGIN_DATA ST. J ,000010102, 5, 12, 7, 3, 2, 2, 7, 6, 9, 5, 6 ST. J ,000010102, G, G, G, G, G, G, G, G, G, G Corne ,000010301, 13, 13, 10, 6, 5, 7, 14, 16, 18, 22 Corne ,000010301, G, G, G, G, G, G, G, G, G, WELLI ,000020301,-999,-999,-999,-999,-999,-999,-999,-999 START_REF, 0 NUMSTEPS, 24 AVG_TIME, 60 UNITS, PPB STATIONS, 1342 ! START HOUR ! ID AIRS CODE 0000 0100 0200 0300 0400 0500 0600 !------------------- --------- ---- ---- ---- ---- ---- ---- ---- ---- ---- ---- ---- BEGIN_DATA ST. J ,000010102, 5, 12, 7, 3, 2, 2, 7, 6, 9, 5, 6 ST. J ,000010102, G, G, G, G, G, G, G, G, G, G Corne ,000010301, 13, 13, 10, 6, 5, 7, 14, 16, 18, 22 Corne ,000010301, G, G, G, G, G, G, G, G, G, WELLI ,000020301,-999,-999,-999,-999,-999,-999,-999,-999 START_REF, 0 NUMSTEPS, 24 AVG_TIME, 60 UNITS, PPB STATIONS, 1342 ! START HOUR ! ID AIRS CODE 0000 0100 0200 0300 0400 0500 0600 !------------------- --------- ---- ---- ---- ---- ---- ---- ---- ---- ---- ---- ---- BEGIN_DATA ST. J ,000010102, 5, 12, 7, 3, 2, 2, 7, 6, 9, 5, 6 ST. J ,000010102, G, G, G, G, G, G, G, G, G, G Corne ,000010301, 13, 13, 10, 6, 5, 7, 14, 16, 18, 22 Corne ,000010301, G, G, G, G, G, G, G, G, G, WELLI ,000020301,-999,-999,-999,-999,-999,-999,-999,-999 AIRNow Database Quality Control START_REF, 0 NUMSTEPS, 24 AVG_TIME, 60 UNITS, PPB STATIONS, 1342 ! START HOUR ! ID AIRS CODE 0000 0100 0200 0300 0400 0500 0600 !------------------- --------- ---- ---- ---- ---- ---- ---- ---- ---- ---- ---- ---- BEGIN_DATA ST. J ,000010102, 5, 12, 7, 3, 2, 2, 7, 6, 9, 5, 6 ST. J ,000010102, G, G, G, G, G, G, G, G, G, G Corne ,000010301, 13, 13, 10, 6, 5, 7, 14, 16, 18, 22 Corne ,000010301, G, G, G, G, G, G, G, G, G, WELLI ,000020301,-999,-999,-999,-999,-999,-999,-999,-999 START_REF, 0 NUMSTEPS, 24 AVG_TIME, 60 UNITS, PPB STATIONS, 1342 ! START HOUR ! ID AIRS CODE 0000 0100 0200 0300 0400 0500 0600 !------------------- --------- ---- ---- ---- ---- ---- ---- ---- ---- ---- ---- ---- BEGIN_DATA ST. J ,000010102, 5, 12, 7, 3, 2, 2, 7, 6, 9, 5, 6 ST. J ,000010102, G, G, G, G, G, G, G, G, G, G Corne ,000010301, 13, 13, 10, 6, 5, 7, 14, 16, 18, 22 Corne ,000010301, G, G, G, G, G, G, G, G, G, WELLI ,000020301,-999,-999,-999,-999,-999,-999,-999,-999 010100010001111010010101010101001010011110100100101010010100000111000100101 START_REF, 0 NUMSTEPS, 24 AVG_TIME, 60 UNITS, PPB STATIONS, 1342 ! START HOUR ! ID AIRS CODE 0000 0100 0200 0300 0400 0500 0600 !------------------- --------- ---- ---- ---- ---- ---- ---- ---- ---- ---- ---- ---- BEGIN_DATA ST. J ,000010102, 5, 12, 7, 3, 2, 2, 7, 6, 9, 5, 6 ST. J ,000010102, G, G, G, G, G, G, G, G, G, G Corne ,000010301, 13, 13, 10, 6, 5, 7, 14, 16, 18, 22 Corne ,000010301, G, G, G, G, G, G, G, G, G, WELLI ,000020301,-999,-999,-999,-999,-999,-999,-999,-999 START_REF, 0 NUMSTEPS, 24 AVG_TIME, 60 UNITS, PPB STATIONS, 1342 ! START HOUR ! ID AIRS CODE 0000 0100 0200 0300 0400 0500 0600 !------------------- --------- ---- ---- ---- ---- ---- ---- ---- ---- ---- ---- ---- BEGIN_DATA ST. J ,000010102, 5, 12, 7, 3, 2, 2, 7, 6, 9, 5, 6 ST. J ,000010102, G, G, G, G, G, G, G, G, G, G Corne ,000010301, 13, 13, 10, 6, 5, 7, 14, 16, 18, 22 Corne ,000010301, G, G, G, G, G, G, G, G, G, WELLI ,000020301,-999,-999,-999,-999,-999,-999,-999,-999 START_REF, 0 NUMSTEPS, 24 AVG_TIME, 60 UNITS, PPB STATIONS, 1342 ! START HOUR ! ID AIRS CODE 0000 0100 0200 0300 0400 0500 0600 !------------------- --------- ---- ---- ---- ---- ---- ---- ---- ---- ---- ---- ---- BEGIN_DATA ST. J ,000010102, 5, 12, 7, 3, 2, 2, 7, 6, 9, 5, 6 ST. J ,000010102, G, G, G, G, G, G, G, G, G, G Corne ,000010301, 13, 13, 10, 6, 5, 7, 14, 16, 18, 22 Corne ,000010301, G, G, G, G, G, G, G, G, G, WELLI ,000020301,-999,-999,-999,-999,-999,-999,-999,-999 All roads lead to the DMC… 10:31:45 10:45:21
The last leg of the journey…. Public Weather/News Providers 010100010001111010010101010101001010011110100100101010010100000111000100101 10:45:55 10:55:21 11:00:00
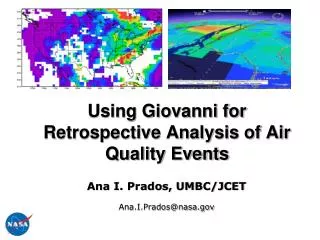
Tools for Locating Active Wildfires Near You NOAA Smoke Forecast Tool - Provides a 48-hour prediction of smoke transport and concentration using NOAA satellite information on the location of wildfires combined with NOAA National Weather Service weather forecast models. Tool is updated daily. GEOMAC Wildland Fire Support - The Geospatial Multi-Agency Coordination Group's internet-based mapping tool to access online maps of current fire locations. MODIS Active Fire Mapping - USDA Forest Service Remote Sensing Applications Center's (RSAC) MODIS Active Fire Mapping web site. Smoke Page Wildfire ResourcesCalifornia Air Resources Board SMP Public Outreach Protocol - Tools and Materials Wildfire Guide for Health Officials CDC Wildfire Fact Sheet National Fire Plan
Downloadable Factsheets Draft – Available Soon