Download
1 / 56
570 likes | 697 Views
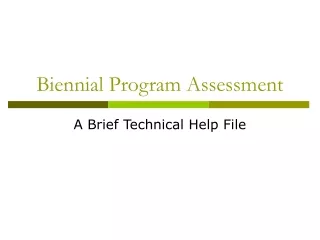
Biennial Report. CCAC Conference 2011. 3 Major Activities of the system and their different roles. Program Assessment – Is the program in alignment with the standards?

E N D
Biennial Report CCAC Conference 2011
3 Major Activities of the system and their different roles Program Assessment – Is the program in alignment with the standards? Biennial Reports – Is the program effective in developing qualified educators and does the program use data to drive its program improvement efforts? Site Visit –Are the Common Standards and Program Standards are implemented in an integrated, effective manner?
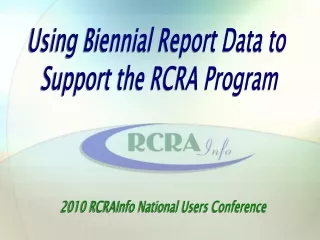
Year 2, Collect Data Year 3, Collect Data Analyze Data to report in Year 4 Year 4, Collect Data Program Assessment Year 1, Collect Data Analyze Data to report in Year 2 Year 5, Collect Data Analyze Data to report in Year 6, Prepare for Site Visit Year 7, Collect Data Follow-Up Year 6, Collect Data Site Visit 7 Year Accreditation Cycle
Accreditation System Are programs effective in preparing competent educators? Biennial Reports Site Visit Program Assessment Are Common Standards and Program Standards implemented in an integrated, effective Manner? Are programs aligned with standards?
Uses for Biennial Reports • Key piece of evidence that an institution is responsive to Common Standards 2 and 9. • Used by review teams during Program Assessment and Site Visits • Together, Biennial Reports, Program Assessment and Site Visits, give a more comprehensive picture of a program sponsor over time than the former system did
2011 – Where are we? • Just completed first three years of full implementation of biennial reports in the accreditation system • All 7 IHE cohorts will have submitted at least 1 biennial report • Yellow BTSA Induction will submit in fall for first time
2011-What’s New? • Site visits that took place in 2009, 2010 and spring of 2011 included biennial reports as part of their evidence • Beginning this past fall (2011), all MS and SS programs must include information about how they are implementing the TPA model they have chosen to use.
Data about TPA Implementation • MS/SS programs should provide information about the following: • The total number of assessors the program uses and the number of assessors who scored in the 2010-11 year. • The number of assessors who successfully completed initial training in 2010-11 and the number who recalibrated in 2010-11. • Reliability of double scoring (% of agreement) • Any modifications made to assessor selection, training, or recalibration.
For which programs is a biennial report submitted? • All approved programs: • Currently approved • Those in transition to new standards (may use different assessments to reflect changes in program) • Those formally deemed (by CTC) as inactive (modified manner)
Structure of the Biennial Report • There are two sections in the Biennial Report • The first section (A) focuses on each educator preparation programs at the institution • EACH PROGRAM must develop its report by summarizing updates to the program, providing counts of candidates and completers and presenting data it has collected and analyzed
Structure of the Biennial Report • The second section (B) is completed by the administrator responsible for all of the programs at the institution • includes an action plan for addressing areas of concern. • ONE SECTION B FOR THE ENTIRE INSTITUTION
Biennial Report Section B reflects the leadership’s summary of all Section A reports. The summary will include: • Trends observed across programs, if any, • Areas of strength across programs, if any, • Areas needing improvement across programs, if any, and • Next steps or a plan of action across programs
Biennial Report, Section A Purpose: Snapshot of each program Part I. Contextual information and program changes Part II. Descriptions of Candidate Assessments and Program Evaluation Methods, Summaries of Data Part III. Analyses of data Part IV. Proposed Program Changes, linked to the data analysis
Section A, Part IProgram Specific Information Part I. Contextual Information • General information about • where the program is located • attributes of the community it serves (e.g., high poverty, non-English speakers) • its mission and goals • how long its been operating. 1 page
Section A, Part I • Additional information includes • how the program is structured (e.g., when it starts and ends, cohort vs. continuous start, traditional vs. intern or both, BCLAD) • what candidates experience during the program • how many candidates and completers it has had for the most recent two years.
Section A, Part I. Context Programs are encouraged to use tables to report information.
Section A, Part II. – Candidate Assessment and Program Effectiveness Data • Program demonstrates how it uses data on an on-going basis to ensure that candidates have the knowledge and can use the competencies described in the standards. ≤ 10 pages
Section A, Part II. – Candidate Assessment and Program Effectiveness Data • Example of BTSA Induction assessment data ≤ 10 pages
Part II. – Candidate Assessment and Program Effectiveness Data • The program must describe the assessment and evaluation procedures or instruments it uses to: • Measure candidates’ competencies and, • Ensure that the program is effectively meeting its candidates’ academic and professional growth needs • Institutions are encouraged to utilize tables or bulleted lists rather than narratives
Part II. Reporting • Identify the data being collected (e.g., CalTPA, PACT, field supervisor observation, employer survey data) • Describe the instrument(s) used to gather data (survey, observation protocol) • Describe how data is collected
Part II. Provide Aggregated Data • Report data from 4-6 key assessments and/or program evaluations • Data must reflect the last two academic years • For those submitting in fall 2011 – that would be 09-10 and 10-11 • For those submitting in fall 2012 – that would be 10-11 and 11-12
Part II. Provide Aggregated Data In choosing which data to use, remember the purpose of biennial reports…. How do you know how well your candidates are doing on competencies required in the standards and how do you know how effective your program is in delivering content and preparing educators?
Part II. Provide Aggregated Data What part of the aggregated data needs to be disaggregated? • By delivery model (traditional, intern, blended) • By site (program offered at two or more sites) Need to be able to see if there are discrepancies in the data.
Part II. Examples of Candidate Assessment Instruments • Methods for assessing whether candidates know and can use competencies identified in the standards: • TPA for MS/SS programs (required reporting) • Key assignments in coursework • Observations during fieldwork, practicum, or clinical practice • Demonstrations at end of program • Portfolios • State survey data for Intern and Induction
Part II. Examples of Program Evaluation Data • Methods for evaluating a program’s effectiveness in preparing educators with competencies required by standards: • Completer/graduate surveys (tied to the standards) • Employer surveys or interviews • Surveys of district-employed field supervisors • Advisory board surveys or community focus groups
Part II. Reporting Data • Tables or charts can report complex data simply, clearly, and accurately. * Tasks were scored on a four-point scale. Passage on a task required a score of at least 3 points.
Part II. Reporting Data, Cont. • Tables or charts can report complex data simply, clearly, and accurately. * Tasks were scored on a four-point scale. Passage on a task required a score of at least 3 points.
Not all Data are Equal! • There are data, good data, and better data for the purposes of program improvement • Data quality can be determined by the amount of information it provides the program
Examples of Data Data: 100% candidates successfully complete EDU 235 or Average grade for all candidates who took EDU 235 in Fall of 08 is 3.45 • What do these examples tell you about program quality or effectiveness? • Does either example guide program improvement?
Examples of Better Data • What are the competencies covered by EDU 235? • Can you describe these competencies as they relate to standards? • TPE, CSTP, NASP? • What key assignments, projects, fieldwork components, etc. are required?
Examples of Better Data Examples of possible data: • Scores on assignments that were scored with a rubric used by all instructors • Competencies need to be tied to explicit standards • Observations can be scored with a rubric tied to competencies
Another Example of Good Data Student Teaching Final Evaluation (Exit Clinical Practice) Completed by Master Teacher and University Supervisor
Best Data • Data from TPE observations during ED 235 (scored with a 4 pt. rubric) is compared to post program information such as the following: Employer Survey data verifies that first year teachers from the X program demonstrate the TPE competencies in their classrooms. What can these data sources tell you about program effectiveness?
Lessons Learned - Data Best Biennial Reports • Include data at a level that can be tied to candidate competencies outlined in the standards • Include BOTH candidate assessments and program/post-program feedback information (employer surveys, completer surveys) • Present data in a way that allows the reader to compare candidate and program performance relative to the standards.
Section A, Part III. Analysis of Data • Program uses results of data analyses to identify: • How well candidates are performing • Areas where candidates are not performing as expected • How well completers are performing • Areas in which completers feel unprepared • How the program is perceived by employers • Identify strengths of program and areas for growth
Analysis of Data Programs may take the data as a whole and reach some conclusions, or may analyze each data source separately. If the latter, any areas of conflict in the data should be addressed. Do not overlook areas where the data indicate some improvements are necessary.
Part IV. Use of Assessment Results for Program Improvement • Program describes how it will use the results of the analyses of data to build on identified strengths and address areas in need of growth/improvement.
Use of Assessments for Program Improvement • What changes have or will be made to the program? • What data will the program continue to watch over time? • Is there a need to improve the assessment tools themselves? • Make sure this section is linked to the data and analysis
Program Improvements Chart or Table may be useful here too.
Biennial Report, Section BInstitutional Summary/Action Plan Purposes: Ensure that the unit leadership is monitoring the effectiveness of each of its programs. Provide a snapshot of the institution’s processes for utilizing data to increase program effectiveness.
Section BInstitutional Summary/Action Plan • Unit leadership will review reports from each program and identify: • Trends across programs, • Strengths across programs, and • Areas needing growth across programs. • Unit describes a plan of action to • improve the performance of programs that are not being effective and • ensure the quality of programs across the unit.
Section B - Institution • Summary is submitted by unit leader: • Dean • Director of Education • Superintendent • Head of the Governing Board of the Program Sponsor 1 Page
Section B - Institution • Summary identifies: • Trends observed across programs • Areas of strength • Areas for improvement • Next steps or a plan of action 1 Page
Section B - Institution What if you only offer one program? How then does Section B differ from the Plan of Action in Section A? Do you provide something different from a multi program institution?
Page Parameters • Section A for each program should be approximately 10 pages. • Section B should be approximately 1-2 pages. • A BIENNIAL REPORT SHOULD BE SHORT AND CONTAIN LIMITED NARRATIVE. LET CHARTS AND GRAPHS HELP TELL THE STORY.
When are they due? • Biennial Reports are due in the summer/fall following years 1, 3, and 5 of the cohort cycle • Due to the Commission • August 15, • September 15, or • October 15 They are due FOLLOWING the second academic year during which the data is collected.
How are they submitted? Electronically – via E-mail to BiennialReports@ctc.ca.gov
How are Biennial Reports Reviewed? Several levels of review: 1) Staff review 2) Program Assessment Reviewers 3) Site Visit Teams
Staff Review • CTC staff will review the reports and, if necessary, seek additional information • Feedback will be provided to program sponsors in a timely manner • A summary of the information from the Biennial Reports will be shared in the aggregate with the Committee on Accreditation