Download
1 / 18
180 likes | 348 Views
A Flash-flood Forecasting and Warning System for Urban Settings: A Proof-of-Concept Study. John Fulton U.S . Geological Survey Pennsylvania Water Science Center Pittsburgh, Pennsylvania. Our Team. John Schombert. Bob Davis Bill Drzal. Dr . Bill Plant. Bob Hainly Liz Hittle.

E N D
A Flash-flood Forecasting and Warning System for Urban Settings: A Proof-of-Concept Study John Fulton U.S. Geological Survey Pennsylvania Water Science Center Pittsburgh, Pennsylvania
Our Team John Schombert • Bob Davis • Bill Drzal • Dr. Bill Plant • Bob Hainly • Liz Hittle
Problem Statement • Forecasting peak flows and stage in small to medium-sized watersheds (<200 mi2) can be challenging • Results can be catastrophic • Western PA has a long history of regional floods • Saint Patrick’s Day Flood (1936) • Hurricane Agnes (1972) • January flooding (1996) • Hurricanes Fran and Ivan (2004) • Localized-watershed flooding • Pine Creek Watershed (1986) resulted in nine deaths • Turtle Creek Watershed (1987) resulted in one death • Girtys Run Watershed
WhyIs Forecasting Problematic? • Hydrologic response to extreme-weather events is measured in minutes • Volume of water available as DRO is greater, which causes a reduction in Tc and an increase in the timing of peak stage • Impervious cover and reduced infiltration • Hydraulic efficiencies associated with engineered-storm controls in a sewershed • Little time for emergency management agencies and the public to respond
The Objective • Design and implement a reliable, forecasting and warning system that relies on near-real time tools • Raingage data • Radar-rainfall data (AMBER) • Streamgages • Flood-routing models • Communication network
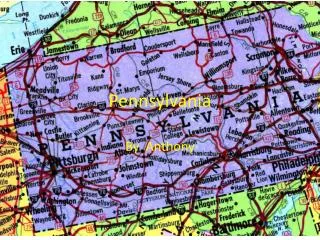
Study Area • Pine Creek Watershed • DA 67.3 mi2 • Mean basin elev 1,120 ft • Adjusted basin slope 7.9 • Girtys Run Watershed • DA 13.4 mi2 • Mean basin elev 1,070 ft • Adjusted basin slope 9.7
How Do We Get There? • Task 1 Network Design and Operation • Subtask 1.1 StreamgageSitingand Installation • Subtask 1.2 Communication Network • Subtask 1.3 Thresholds and Data Transmission • Task 2 Flood-forecasting Model
Proof-of-Concept WSR-88 “Actual”Peak Stage and Discharge Floodwave Routing Surfacewater Velocity Stage Thresholds
Subtask 1.1 Streamgage Siting and Installation • Identify candidate sites as a function of basin hydrology and demographics using GIS • Downstream • Tributary confluences • Impervious cover • Land type dominated by rapid-runoff • Engineered structures, drainage, sewers • Minimum Tc • Upstream • Contractions (bridge openings or culverts) • Backwater • Populated and frequently flooded areas • Flow-accumulation targets of 12.5, 37.5, 62.5, 87.5 percent/mi2 • Each streamgaging station will include • Shelter • Non-contact, down-looking radar stage sensor • Electronic data logger • Continuous wave coherent microwave • VHF radio or satellite transmitter (GOES or Iridium network) 3621 3621 3621 3619 3619 3619 3621 3620 3620 3620 3621 3619 3618 3614 3618 3614 3618 3614 3617 3617 3617 3619 3620 3620 3616 3615 3616 3616 3615 3615 3618 3614 3617 3611 3611 3611 3618 3614 3612 3612 3612 3617 3613 3613 3613 3616 3615 3611 3616 3615 3612 3613 3611 3610 3610 3610 3612 3613 Ohio River Ohio River Ohio River Allegheny River Allegheny River Allegheny River 3610 3610 Ohio River Allegheny River Ohio River Allegheny River
Subtask 1.2 Communication Network • Establish a communication network • Terrestrial –based • VHF radios • Satellite-based • GOES • Iridium network • Provide redundancy
Subtask 1.3 Flash-flood Thresholds • Establish thresholds • Stage targets • 25, 50, 75 percent bankfull • Radar-rainfall • Intensity, duration, frequency • Map of modeled flood frequencies (return periods) • DHM produce gridded flow forecasts from which frequency (return period) forecasts are derived using historical simulations • Threshold frequency map using local information or the 2-yr out-of-bank assumption for flash flood determination Courtesy of Brian Cosgrove, NWS (2010)
Task 2 – Flood-forecasting Model • KINEROS2 • NWS Pittsburgh WFO • Preliminary results for Girtys Run are promising • Additional work is needed to address urban hydrology • Sewersheds • Culverts • Bridge openings Courtesy of Larry Struble, NWS (2010)
Task 2 – Flood-forecasting Model • 1D hydraulic model • USGS • Ingests measured field data • Velocity and discharge • Computes discharge and stage downstream • Kalman Filter • Set of equations that provides an efficient computational (recursive) means to estimate the state of a process, in a way that minimizes the mean of the squared error • Projects the current state estimate ahead in time • Originally developed for use in spacecraft navigation
Continuous-wave Coherent Microwave • Equipment • Fixed-mount • Stand-alone • Reliable and accurate • Analysis • Efficient • Real-time • Accurate over a range of flows and conditions With the proviso that data can be obtained at a single locationand not require historical data
Continuous-wave Coherent Microwave • CWC Microwave (RiverScat) • Heterodyne transceiver • Bragg Scatter • 14.2 GHz • Ku-band • Increased +20 dB SNR • 4.5 one-way beam width • 2, fixed-mount, 1-ft diameter antenna • 55 amp-hr battery, 10-amp solar controller, 123-watt solar panel • Algorithm processes +/- velocities • Information Entropy
Analysis – Information Entropy • Q = f Vmax A • (M) is a measure of a streams “happy place” • Invariant to • flow • velocity • stage • channel geometry • bed form and material • slope • alignment • Does not require historical data Vavg = f Vmax
Questions/Comments/Barbs? Collaborators: 3 Rivers Wet Weather National Weather Service WFO, Pittsburgh, PA University of Washington, Applied Physics Laboratory