Download
1 / 1
10 likes | 109 Views
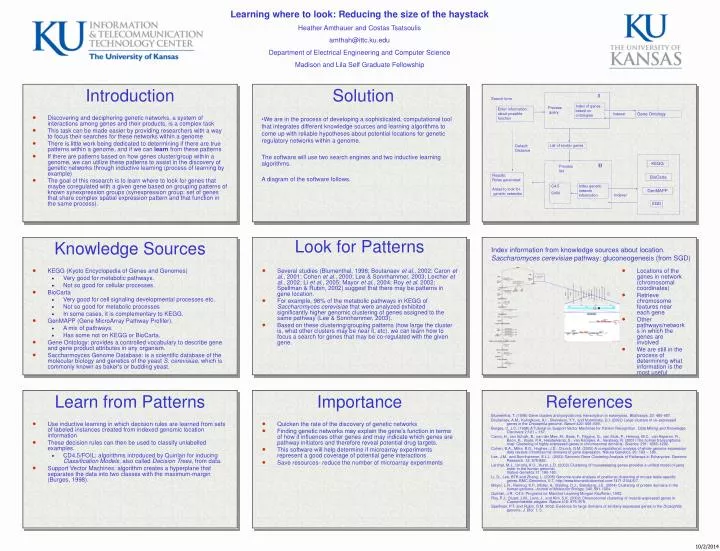
I. Search form. Index of genes based on ontologies. Process query. Enter information about possible function. Gene Ontology. Indexer. List of similar genes. Default: Distance. KEGG. II. Process list. Results: Rules generated Areas to look for genetic networks. BioCarta.

E N D
I Search form Index of genes based on ontologies Process query Enter information about possible function Gene Ontology Indexer List of similar genes Default: Distance KEGG II Process list Results: Rules generated Areas to look for genetic networks BioCarta C4.5 SVM Index genetic network information GenMAPP Indexer SGD Learning where to look: Reducing the size of the haystack Heather Amthauer and Costas Tsatsoulis amthah@ittc.ku.edu Department of Electrical Engineering and Computer Science Madison and Lila Self Graduate Fellowship Introduction Solution • Discovering and deciphering genetic networks, a system of interactions among genes and their products, is a complex task • This task can be made easier by providing researchers with a way to focus their searches for these networks within a genome • There is little work being dedicated to determining if there are true patterns within a genome, and if we can learn from these patterns • If there are patterns based on how genes cluster/group within a genome, we can utilize these patterns to assist in the discovery of genetic networks through inductive learning (process oflearning by example) • The goal of this research is to learn where to look for genes that maybe coregulated with a given gene based on grouping patterns of known synexpression groups (synexpression group: set of genes that share complex spatial expression pattern and that function in the same process). • We are in the process of developing a sophisticated, computational tool that integrates different knowledge sources and learning algorithms to come up with reliable hypotheses about potential locations for genetic regulatory networks within a genome. The software will use two search engines and two inductive learning algorithms. A diagram of the software follows. Look for Patterns Knowledge Sources Index information from knowledge sources about location.Saccharomyces cerevisiae pathway: gluconeogenesis (from SGD) • KEGG (Kyoto Encyclopedia of Genes and Genomes) • Very good for metabolic pathways. • Not so good for cellular processes. • BioCarta • Very good for cell signaling developmental processes etc. • Not so good for metabolic processes • In some cases, it is complementary to KEGG. • GenMAPP (Gene MicroArray Pathway Profiler). • A mix of pathways. • Has some not on KEGG or BioCarta. • Gene Ontology: provides a controlled vocabulary to describe gene and gene product attributes in any organism. • Saccharmoyces Genome Database: is a scientific database of the molecular biology and genetics of the yeast S. cerevisiae, which is commonly known as baker's or budding yeast. • Several studies (Blumenthal, 1998; Boutanaev et al., 2002; Caron et al., 2001; Cohen et al., 2000; Lee & Sonnhammer, 2003; Lercher et al., 2002; Li et al., 2005; Mayor et al., 2004; Roy et al. 2002; Spellman & Rubin, 2002) suggest that there may be patterns in gene location. • For example, 98% of the metabolic pathways in KEGG of Saccharomyces cerevisiae that were analyzed exhibited significantly higher genomic clustering of genes assigned to the same pathway (Lee & Sonnhammer, 2003). • Based on these clustering/grouping patterns (how large the cluster is, what other clusters may be near it, etc), we can learn how to focus a search for genes that may be co-regulated with the given gene. • Locations of the genes in network (chromosomal coordinates) • Retrieve chromosome features near each gene • Other pathways/networks in which the genes are involved • We are still in the process of determining what information is the most useful Learn from Patterns Importance References Blumenthal, T. (1998) Gene clusters and polycistronic transcription in eukaryotes. BioEssays, 20: 480-487. Boutanaev, A.M., Kalmykova, A.I., Shevelyov, Y.Y., and Nurminsky, D.I. (2002) Large clusters of co-expressed genes in the Drosophila genome. Nature 420: 666–669. Burges, C. J.C. (1998) A Tutorial on Support Vector Machines for Pattern Recognition. Data Mining and Knowledge Discovery 2:121 – 167. Caron, H., van Schaik, B., van der Mee, M., Baas, F., Riggins, G., van Sluis, P., Hermus, M.C., van Asperen, R., Boon, K., Voute, P.A., Heisterkamp, S., van Kampen, A., Versteeg, R. (2001) The human transcriptome map: Clustering of highly expressed genes in chromosomal domains. Science, 291: 1289–1292. Cohen, B.A., Mitra, R.D., Hughes, J.D., Church, G.M. (2000) A computational analysis of whole genome expression data reveals chromosomal domains of gene expression. Nature Genetics, 26: 183 – 186. Lee, J.M., and Sonnhammer, E.L.L. (2003) Genomic Gene Clustering Analysis of Pathways in Eukaryotes. Genome Research. 13: 875-882. Lercher, M.J., Urrutia, A.O., Hurst, L.D. (2002) Clustering of housekeeping genes provides a unified model of gene order in the human genome.Nature Genetics 31: 180-183. Li, Q., Lee, BTK and Zhang, L. (2005) Genome-scale analysis of positional clustering of mouse testis-specific genes. BMC Genomics, 6:7. http://www.biomedicalcentral.com/1471-2164/6/7. Mayor, L.R., Fleming, K.P., Müller, A., Balding, D.J., Sternberg, J.E. (2004) Clustering of protein domains in the human genome. Journal of Molecular Biology, 340: 991-1004. Quinlan, J.R.: C4.5: Programs for Machine Learning Morgan Kauffman, 1993. Roy, P.J., Stuart, J.M., Lund, J., and Kim, S.K. (2002) Chromosomal clustering of muscle-expressed genes in Caenorhabditis elegans. Nature 418: 975–979. Spellman, P.T. and Rubin, G.M. 2002. Evidence for large domains of similarly expressed genes in the Drosophila genome. J. Biol. 1: 5. • Use inductive learning in which decision rules are learned from sets of labeled instances created from indexed genomic location information • These decision rules can then be used to classify unlabelled examples. • CD4.5/FOIL: algorithms introduced by Quinlan for inducing Classification Models, also called Decision Trees, from data. • Support Vector Machines: algorithm creates a hyperplane that separates the data into two classes with the maximum-margin (Burges, 1998). • Quicken the rate of the discovery of genetic networks • Finding genetic networks may explain the gene’s function in terms of how it influences other genes and may indicate which genes are pathway initiators and therefore reveal potential drug targets. • This software will help determine if microarray experiments represent a good coverage of potential gene interactions • Save resources- reduce the number of microarray experiments