Download
1 / 1

E N D
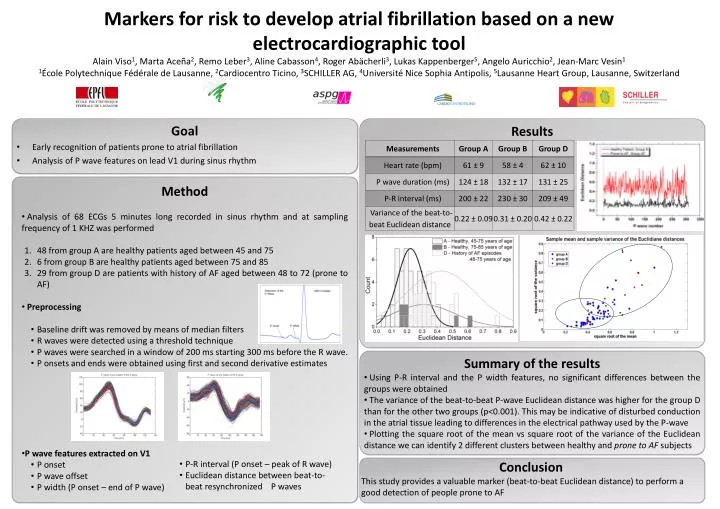
Markers for risk to develop atrial fibrillation based on a new electrocardiographic tool Alain Viso1, Marta Aceña2, Remo Leber3, Aline Cabasson4, Roger Abächerli3, Lukas Kappenberger5, Angelo Auricchio2, Jean-Marc Vesin11École Polytechnique Fédérale de Lausanne, 2Cardiocentro Ticino, 3SCHILLER AG, 4Université Nice Sophia Antipolis, 5Lausanne Heart Group, Lausanne, Switzerland Goal • Early recognition of patients prone to atrial fibrillation • Analysis of P wave features on lead V1 during sinus rhythm Results • Method • Analysis of 68 ECGs 5 minutes long recorded in sinus rhythm and at sampling frequency of 1 KHZ was performed • 48 from group A are healthy patients aged between 45 and 75 • 6 from group B are healthy patients aged between 75 and 85 • 29 from group D are patients with history of AF aged between 48 to 72 (prone to AF) • Preprocessing • Baseline drift was removed by means of median filters • R waves were detected using a threshold technique • P waves were searched in a window of 200 ms starting 300 ms before the R wave. • P onsets and ends were obtained using first and second derivative estimates • P wave features extracted on V1 • P onset • P wave offset • P width (P onset – end of P wave) • Summary of the results • Using P-R interval and the P width features, no significant differences between the groups were obtained • The variance of the beat-to-beat P-wave Euclidean distance was higher for the group D than for the other two groups (p<0.001). This may be indicative of disturbed conduction in the atrial tissue leading to differences in the electrical pathway used by the P-wave • Plotting the square root of the mean vs square root of the variance of the Euclidean distance we can identify 2 different clusters between healthy and prone to AF subjects • P-R interval (P onset – peak of R wave) • Euclidean distance between beat-to-beat resynchronized P waves Conclusion This study provides a valuable marker (beat-to-beat Euclidean distance) to perform a good detection of people prone to AF