Download
1 / 1
10 likes | 85 Views
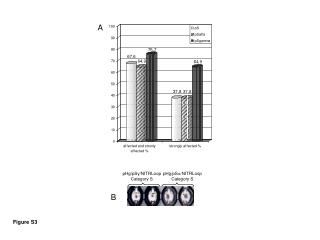
Figure S3. Abundance of miRNAs affected by host genotypes.

E N D
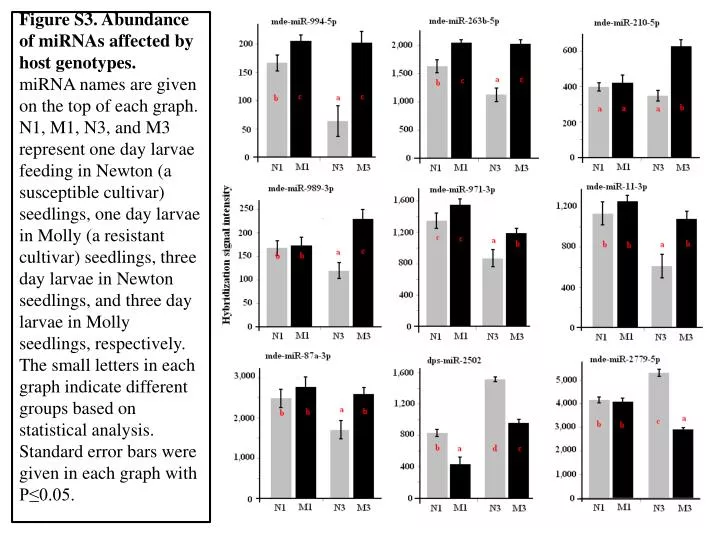
Figure S3. Abundance of miRNAs affected by host genotypes. miRNA names are given on the top of each graph. N1, M1, N3, and M3 represent one day larvae feeding in Newton (a susceptible cultivar) seedlings, one day larvae in Molly (a resistant cultivar) seedlings, three day larvae in Newton seedlings, and three day larvae in Molly seedlings, respectively. The small letters in each graph indicate different groups based on statistical analysis. Standard error bars were given in each graph with P≤0.05.