Download
1 / 18
180 likes | 326 Views
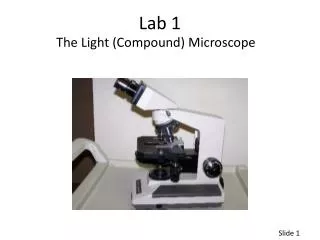
Lab 1. Lab rules and safety procedures Prelabs Postlabs Grading/testing Graphing ***Lab Q’s- read the question and answer what they are asking you!. Rules. NO eating or drinking Bags must be under table or by door Wear appropriate clothing Tie long hair back Clean up after yourself!

E N D
Lab 1 • Lab rules and safety procedures • Prelabs • Postlabs • Grading/testing • Graphing ***Lab Q’s- read the question and answer what they are asking you!
Rules • NO eating or drinking • Bags must be under table or by door • Wear appropriate clothing • Tie long hair back • Clean up after yourself! • TURN OFF CELL PHONES • Do not arrive late • More than 15 minutes late will not be permitted in lab
Safety • Eyewash station/shower/fire extinguisher • First aid • Broken glass • Spills • Waste • MSDS
Pre-lab assignments • Due when you walk in • Two prelabs • Summary • Questions • Late prelabs not accepted • Originals only! • Summaries must be typed
Post-lab assignments • Due the following lab period • Staple any additional pages
Grading/testing • Pre-lab summary • 5 points • Pre-lab questions • 10 points • Post-lab questions • 35 points • Test questions will be included in quizzes/midterm/final
Variables • Independent: The variable that you (the researcher) manipulates • Dependent: The variable that changes when the independent variable changes (i.e. depends on the independent variable) • Controlled: Variables that are kept constant during the experiment
Example You are examining differences in growth rates in plants exposed to 8 hours and 4 hours of sunlight respectively. Independent variable- Hours of sunlight Dependent variable- growth rate of plant Controlled variables- amount of water given, fertilizer, temperature
Groups • Control – The group that is not exposed to the independent variable • Experimental- The group that IS exposed to the independent variable
Graphing • Features of a graph • Title, include figure number • Axis labels, Time, Distance • Units (with labels), i.e., Distance (cm) • Legend (if necessary) • Description, i.e. Change in temperature over time
Graphing Graphs show trends, tables show exact data X-axis- independent variable Y-axis- dependent variable
Types of Graphs • Line • Represent continuous variables • Bar • Represent discrete variables • Box plot • Depicts median • Error bars • Depicts means • Area • Stacked line graphs, changes in percentages • Scatter • Relationship between two measured variables as a scatter of individual points
Basic Rules • Use graph paper • Plan ahead • Make note of the largest numerical value and make sure your scale is large enough • Use your space • The graph should fill most of the paper, leaving room for proper axis labeling • Start the graph at a logical point • Usually 0, but not always • Ex. Temp. If the lowest temp is 51, start at 50.
Basic Rules • Use a logical scale and stick with it • Use increments of 0.1, 1, 2, 5 or 10 • If more than 1 line is used, include a key in the upper right corner of the graph • Make sure they are different enough from each other to be noticeable • Don’t connect the dots, use trend lines
Examples Make sure the data is properly proportioned to the graph
There's no title. What's it a graph of? Who knows? • There are no labels on the x or y axis. What are those numbers? Who knows? • There are no units on the x or y axis. Is this a graph of speed in miles per hour or a graph of temperature in Kelvins? Who can tell? • Somebody played "connect the dots". This should be a nice straight line which goes through the points or a curve that tends to follow them.