Download
1 / 12
120 likes | 204 Views
Presented by Jodi K. Haponski (GSSP Summer Program) Mentors Radina P. Soebiyanto (USRA/NASA) Richard K. Kiang(NASA). Seasonal Influenza Dependency on Environmental and Meteorological Parameters. Background. Most common disease Annually Infects 5-15% of global population

E N D
Presented by Jodi K. Haponski (GSSP Summer Program) Mentors Radina P. Soebiyanto (USRA/NASA) Richard K. Kiang(NASA) Seasonal InfluenzaDependency on Environmental and Meteorological Parameters
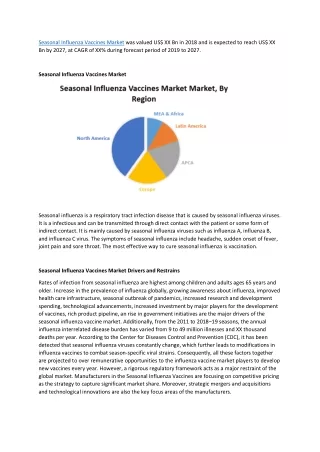
Background • Most common disease • Annually Infects 5-15% of global population • Annually in the U.S: • Up to 200,000 hospitalizations, at least 30,000 deaths • Estimated economic burden is ~87.1 billion
Motivation • Many new influenza strain first appear in tropical regions • Influenza spread varies with latitude • Seasonal in temperate climate • Year-round outbreaks in tropical climates
My Studies • Study area: Hong Kong • Sub-tropical climate • Comfortable temperatures in the winter months • Temperature low of 6 C (~43 F) • Summers are hot and humid with occasional showers and thunderstorms • Temperatures often exceed 31 C (~88 F) • DATA • All reported flu cases in Hong Kong • Obtained weekly data from 2006-2009 • Satellite Derived Data • Land Surface Temperature (LST) from MODIS data set • Precipitation from TRMM 3B42 • GOALS • Determine a relationship between environmental factors and number of disease cases • Model and forecast with the above results
Methods for Modeling • Hilbert Huang Transform, using EEMD (Ensemble Empirical Mode Decomposition) 2. Stepwise Fit • Includes only significant variables in model 3. Remove dependent variables in model HHT: Series of Decomposed Signals. Uses empirical mode decomposition (EMD) to finitely decompose the original into a well-defined Hilbert transform. Original Data: Nonlinear & Nonstationary Time Series • Decomposed Signal: • Linear and Stationary
1. EEMD Original Signal Decomposed Signals
2. Step-wise Fit: Best Signals • First let all decomposed environmental signals make up the model • Fit each signal with the flu signal (using univariate regression) • Remove any signal with a p-value greater than .05
2. Step-wise Fit: ‘In’ Variables Performed multivariate regression Signal is removed from model if it’s p-value is greater than .1 Signal added back into the model if it’s p-value is less than .05
The correlation coefficients were computed between each signal decomposition • Two signals are labeled dependent if their correlation is greater than .5 • Signals were eliminated based on p-values
Resulting Model: First Figure: Second Figure: TRMM, 5th signal removed from model
Conclusions • The EEMD method was able to give insight into the seasonal relationship between the influenza dynamics with the environmental factors • With only two years of training data, we were able to obtain relatively good prediction results