Download
1 / 56
570 likes | 799 Views
Predictive Pre-cooling Control For Low Lift Radiant cooling USING BUILDING THERMAL MASS. Nick Gayeski, PhD candidate in Building Technology August 2010, Dissertation Defense. Topics . 1. Thesis 2. Motivation 3. Low lift cooling systems (LLCS) 3.1 Low lift chiller performance

E N D
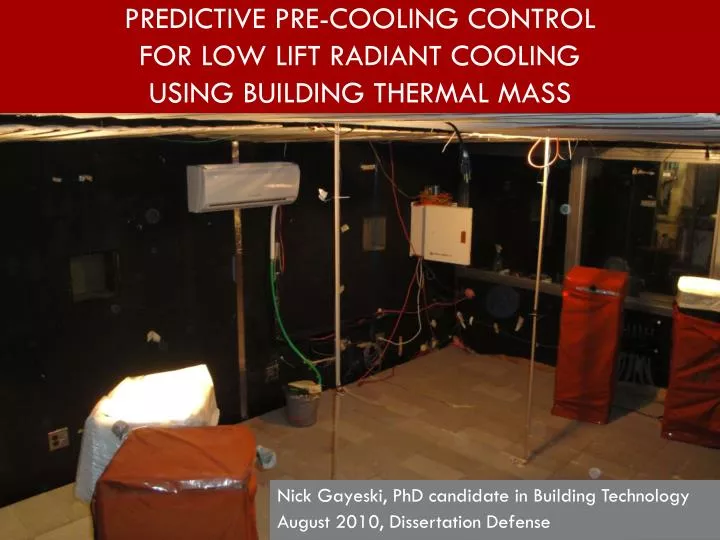
Predictive Pre-cooling Control For Low Lift Radiant cooling USING BUILDING THERMAL MASS Nick Gayeski, PhD candidate in Building Technology August 2010, Dissertation Defense
Topics 1. Thesis 2. Motivation 3. Low lift cooling systems (LLCS) 3.1 Low lift chiller performance 3.2 Zone temperature model identification 3.3 Predictive pre-cooling control optimization 4. Experimental assessment of LLCS 5. Future research 6. Summary of original contributions
1. Thesis Predictive pre-cooling control for low lift radiant cooling using building thermal mass can lead to significant sensible cooling energy savings. • What is a low-lift cooling system (LLCS)? • How is it implemented using building thermal mass? • How is predictive pre-cooling control achieved? • How significant are the energy savings in a real installation?
2. Motivation: energy and climate Addressing energy, climate and development challenges • Buildings are responsible for 40% of energy and 70% of electricity consumption in the US1 • Low cost carbon emission reduction potential2 • Most rapidly developing cities in cooling-dominated climates3 • Increasing demand for thermal comfort4 USDOE 2006. Building Energy Databook IPCC 2007. Fourth Assessment Report Sivak 2009. Energy Policy 37 McNeil and Letschert 2007. ECEEE 2007 Summer Study
2. Motivation: better buildings Leveraging integrated design, advanced HVAC, and building monitoring and automation • Using integrated design to enhance active mechanical system efficiency through thermal storage • Applying HVAC technologies in a coordinated manner for synergistic energy savings • Growth in building monitoring and automation creates opportunities for intelligent control
Topics 1. Thesis 2. Motivation 3. Low lift cooling systems (LLCS) 3.1 Low lift chiller performance 3.2 Zone temperature model identification 3.3 Predictive pre-cooling control optimization 4. Experimental assessment of LLCS 5. Future research 6. Summary of original contributions
3. Low lift cooling systems (LLCS) Low lift cooling system: a cooling strategy that leverages the following technologies to reduce cooling energy: • Variable speed compressors • Hydronic distribution with variable flow • Radiant cooling • Thermal energy storage (TES) • Pre-cooling control • Dedicated outdoor air systems (DOAS)
3. Low lift cooling systems (LLCS) Low lift cooling systems save cooling energy by • Operating chillers more efficiently at low lift more of the time through predictive pre-cooling control • Night time operation • Spreading out the cooling load to operate at part capacity • Radiant cooling • Reducing energy for transporting cooling to a space • Providing ventilation and dehumidification efficiently
Prior research on component strategies • Variable speed compressors, pumps and fans (Hiller, Glicksman, Purdue, Armstrong, UIUC, NIST) • Radiant cooling (Olesen, Adlam, Simmonds, Scheatzle, Feustel, Stetiu) • Thermal energy storage (TES) (Braun, Henze, Norford, Rabl, Koschenz, Lehmann, Roth, Kintner-Meyer, Emery, Armstrong) • Pre-cooling control (Braun, Henze, Armstrong) • Dedicated outdoor air systems (DOAS) (Mumma, Dieckmann, Larranga)
Prior research on LLCS shows significant cooling energy savings potential Simulated energy savings: 12 building types in 16 cities relative to a DOE benchmark HVAC system Total annual cooling energy savings • 37 to 84% in standard buildings, average 60-70% • -9 to 70% in high performance buildings, average 40-60% (Katipamula et al 2010, PNNL-19114)
LLCS cooling energy savings in Atlanta Simulated total annual cooling energy savings: • in a medium size office building • in Atlanta • over a full year • with respect to a variable air volume (VAV) system served by a variable-speed chiller with an economizer and ideal storage • similar to a split-system air conditioner (SSAC) used as an experimental base line, with some differences 28 % annual cooling energy savings (Katipamula et al 2010, PNNL-19114)
700 psia Low lift vapor compression cycle requires less work 600 500 400 300 60 Low-lift refers to a lower temperature difference between evaporation and condensation 200 Predictive pre-cooling of thermal storage and variable speed fans 40 T - Temperature (°C) Variable speed compressor 20 100 Radiant cooling and variable speed pump 0 1 1.2 1.4 1.6 1.8 S - Entropy (kJ/kg-K)
LLCS operates achiller at low lift more of the time Load forecasts Identify building temperature response models Predict 24-hour optimal chiller control schedule Building data Charge active TES Variable capacity chiller Direct zone cooling Pre-cool passive TES Occupied zone Pre-cool concrete-core thermal energy storage
LLCS research overview • Develop the pre-cooling control and experimentally test an LLCS • Optimize control of a chiller over a 24-hour look-ahead schedule to minimize daily chiller energy consumption by operating at low lift conditions while maintaining thermal comfort • Informed by data-driven zone temperature response models and forecasts of climate conditions and loads • Informed by a chiller performance model that predicts chiller power and cooling rate at future conditions for a chosen control
Topics 1. Thesis 2. Motivation 3. Low lift cooling systems (LLCS) 3.1 Low lift chiller performance 3.2 Zone temperature model identification 3.3 Predictive pre-cooling control optimization 4. Experimental assessment of LLCS 5. Future research 6. Summary of original contributions
3.1 Low lift chiller performance Predictive pre-cooling control requires a chiller model to predict chiller power consumption, cooling capacity and COP at low-lift To identify a chiller model under low lift conditions: • Built a heat pump test stand • Experimentally tested the performance of a heat pump at low pressure ratios, which was later converted to a chiller for LLCS • Identified an empirical model of chiller performance useful for predictive control
Measured heat pump performance at many steady state conditions • Tested 131 combinations of the following conditions • To identify a model of chiller power, cooling rate, and COP as a function of all 4 variables
Test results show expected higher COPs at low lift conditions Low lift operation COP ~ 5-10 Typical operation COP ~ 3.5 EER 51 34 17
Empirical models accurately represent chiller cooling capacity, power and COP 4-variable cubic polynomial models
LLCS controls enable the chiller to operate at low lift conditions and higher COPs Night time operation Radiant cooling Load spreading Te = Evaporating temperature, To = Outdoor air temperature
Topics 1. Thesis 2. Motivation 3. Low lift cooling systems (LLCS) 3.1 Low lift chiller performance 3.2 Zone temperature model identification 3.3 Predictive pre-cooling control optimization 4. Experimental assessment of LLCS 5. Future research 6. Summary of original contributions
3.2 Zone temperature model identification LLCS control requires zone temperature response models to predict temperatures and chiller performance • Develop data-driven models from which to predict • Zone operative temperature (OPT) • The temperature underneath the concrete slab (UST) • Return water temperature (RWT) and ultimately chiller evaporating temperature (EVT) from which chiller power and cooling rate can be calculated • Assume ideal forecasts of outdoor climate and internal loads • Implement data-driven modeling on a real test chamber
Existing transfer function modeling methods can be applied to predict zone temperature OPT = operative temperature OAT = outdoor air temperature AAT = adjacent zone air temperature QI = heat rate from internal loads QC = cooling rate from mechanical system a,b,c,d,e = weights for time series of each variable • (Inverse) comprehensive room transfer function (CRTF) [Seem 1987] • Steady state heat transfer physics constrain CRTF coefficients
Evaporating temperature is predicted from intermediate temperature response models • Chiller power and cooling rate depend on • evaporating temperature, which is coupled to • return water temperature, and thus to the • state of thermal energy storage, in this case a radiant concrete floor • Predict concrete floor under-slab temperature (UST) using a transfer function model • Predict return water temperature (RWT) using a low-order transfer function model in UST and cooling rate QC • Superheat relates RWT to evaporating temperature (EVT)
Data-driven models identified for a test chamber with a radiant concrete floor Temperature sensors: OPT, OAT, AAT, UST, RWT Power to internal loads: QI Radiant concrete floor cooling rate: QC
X X x x Data-driven models can be identified from a small set of temperature measurements Typical temperature measurements at each location below: • Outdoor air temperature • Surface temperature • Zone air temperature • Concrete floor temperature • In a real building: • Outdoor air temperature • Zone globe temperature • Zone air temperature • Concrete slab temperature x x X X X X X West Wall X South Wall Floor/Ceiling North Wall 12 ft X X x x X X 8 ft EastWall 17 ft
Models trained using a few days of data Sample training temperature data Sample training thermal load data
Transfer function models accurately predict training data temperatures Operative temperature (OPT) Under-slab temperature (UST) Return water temperature (RWT) Root mean square error (RMSE) for training data OPT RMSE = 0.03 K UST RMSE = 0.04 K RWT RMSE = 0.68 K
Models validated based on accuracy of predicting different data 24-hours-ahead Sample validation temperature data Sample validation thermal load data
Transfer function models accurately predict zone temperatures 24-hours-ahead Operative temperature (OPT) Under-slab temperature (UST) Return water temperature (RWT) Root mean square error (RMSE) for 24 hour ahead prediction of validation data OPT RMSE = 0.08 K UST RMSE = 0.15 K RWT RMSE = 0.84 K
Topics 1. Thesis 2. Motivation 3. Low lift cooling systems (LLCS) 3.1 Low lift chiller performance 3.2 Zone temperature model identification 3.3 Predictive pre-cooling control optimization 4. Experimental assessment of LLCS 5. Future research 6. Summary of original contributions
3.3 Pre-cooling control optimization Optimize chiller operation over 24 hours to minimize energy consumption and maintain thermal comfort • Employ a direct pattern search1 to minimize the objective function by selecting an optimal schedule of 24 compressor speeds2, one for each hour • Use chiller model to calculate cooling rate and power consumption • Use temperature response models to predict zone temperatures to ensure comfort is maintained See Lewis et al 1999, SIAM J. of Optimization or MATLAB Optimization Toolbox Given forecasts of OAT, optimal condenser fan speeds are determined by the choice of compressor speed
Optimization minimizes energy, maintains comfort, and avoids freezing the chiller • rt = electric rate at time t, or one for energy optimization • Pt = system power consumption as a function of past compressor speeds and exogenous variables • = weight for operative temperature penalty • PENOPTt = operative temperature penalty when OPT exceeds ASHRAE 55 comfort conditions • PENEVTt = evaporative temperature penalty for temperatures below freezing • = Vector of 24 compressor speeds, one for each hour of the 24 hours ahead
Perform optimization at every hour with current building data and new forecasts Pattern search initial guess at current hour 24-hour-ahead forecasts of outdoor air temperature, adjacent zone temperature, and internal loads (OAT, AAT, QI) Pattern search algorithm determines optimal compressor speed schedule for the next 24 hours Operate chiller for one hour at optimal state
Predictive pre-cooling control maintains comfort and reduces energy consumption
Predictive pre-cooling control maintains comfort and reduces energy consumption
Topics 1. Thesis 2. Motivation 3. Low lift cooling systems (LLCS) 3.1 Low lift chiller performance 3.2 Zone temperature model identification 3.3 Predictive pre-cooling control optimization 4. Experimental assessment of LLCS 5. Future research 6. Summary of original contributions
4. Experimental assessment of LLCS Prior research shows dramatic savings from LLCS, but • Based entirely on simulation • Assumes idealized thermal storage, not a real concrete floor • Chiller power and cooling rate are not coupled to thermal storage, as it is for a concrete radiant floor How real are these savings? What practical technical obstacles exist?
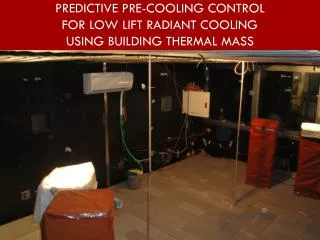
Built and tested a near full-scale LLCS • Built a chiller by modifying the heat pump outdoor unit • Built an LLCS test system with a radiant concrete floor • Implemented the pre-cooling optimization control • Tested LLCS under a typical summer week in Atlanta (and next Phoenix) subject to internal loads • Compared the LLCS performance to a baseline system - a high efficiency (SEER ~ 16) variable capacity split-system air conditioner (SSAC)
FROM RADIANT FLOOR CONDENSER FROM INDOOR UNIT (CLOSED) BPHX TO INDOOR UNIT (CLOSED) COMPRESSOR TO RADIANT FLOOR ELECTRONIC EXPANSION VALVE TEST CHAMBER CLIMATE CHAMBER LLCS and SSAC use the same outdoor unit IDENTICAL FOR LLCS AND BASE CASE SSAC
LLCS provides chilled water to a radiant concrete floor (thermal energy storage) 17’ EXPANSION TANK FILTER TO CHILLER RADIANT FLOOR 12’ BPHX RADIANT MANIFOLD FROM CHILLER WATER PUMP TEST CHAMBER CLIMATE CHAMBER
Chiller/heat pump Radiant concrete floor
LLCS chiller Brazed plate heat exchanger SSAC (SEER~16) Standard mini-split indoor unit
Tested LLCS for a typical summer week in Atlanta subject to standard internal loads Atlanta typical summer week and standard efficiency loads Based on typical meteorological year weather data Assuming two occupants and ASHRAE 90.1 2004 loads Run LLCS for one week *(after a stabilization period) Run split-system air conditioner (SSAC) for one week* Compare sensible cooling only Mixing fan treated as an internal load Repeat for Phoenix typical summer week, high efficiency loads – to be completed after climate chamber HVAC repairs
Outdoor climate conditions Internal loads Atlanta test Phoenix test
LLCS ENERGY SAVINGS relative to SSAC in Atlanta subject to standard loads Similar to simulated total annual cooling energy savings, 28 percent, by (Katipamula et al 2010) • Latent cooling is deducted by measuring condensate water from the SSAC, calculating the total enthalpy associated with its condensation, and dividing it by the average SSAC COP over the week. • Assuming no latent cooling by the LLCS
LLCS THERMAL PERFORMANCE relative to SSAC in Atlanta subject to standard loads • Standard efficiency loads result in large air temperature rise • OPT rises by as much as a 6 Celsius over 10 occupied hours • Belowthe ASHRAE 55 limit of 3.3 C/4 hr, but may still be a comfort issue °F 77 Temperature (C) 67 Occupied hours
Limitations of the existing LLCS test chamber • Radiant floor capacity should be increased by decreasing pipe spacing, permitting higher evaporating temperatures • Zone thermal load should be better matched to both the chiller capacity and the radiant floor capacity • Improve the design and control of the BPHX chiller COP, as-built COPs are lower than COPs measured on the test stand • Add insulation below the concrete floor to increase thermal storage efficiency and create a more representative LLCS • Improvements likely to yield better LLCS performance