Download
1 / 26
260 likes | 380 Views
The HF Radar System in the Basque Country First validation and data analysis results. Anna Rubio, Julien Mader, Manuel González, Almudena Fontán, Vicente Fernandez (QUALITAS REMOS), J.A. Aranda (Euskalmet). Surface currents in the SE of the Bay of Biscay during 1978

E N D
The HF Radar System in the Basque Country First validation and data analysis results Anna Rubio, Julien Mader, Manuel González, Almudena Fontán, Vicente Fernandez (QUALITAS REMOS), J.A. Aranda (Euskalmet)
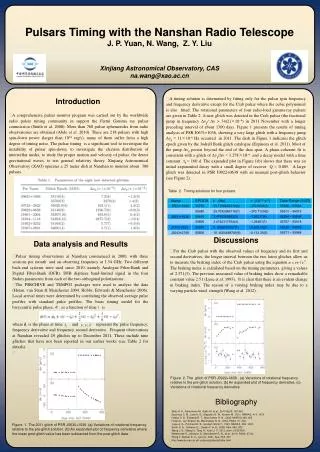
Surface currents in the SE of the Bay of Biscay during 1978 15,000 plastic drift cards thrown into the sea from different coastal points REF: HYDROLOGICAL STUDIES AND SURFACE CURRENTS IN THE COASTAL AREA OF THE BAY OF BISCA Y. Miguel Ibañez Artica.Instituto Geográfico Vasco. Lurralde :inv. espac. N. 2 (1979) p. 37-75 ISSN 1697-3070, extracted from: http://www.ingeba.org/lurralde/lurranet/lur02/iba02/iba02.htm
Outline • Introduction: Description of the Basque and some observations over the slope • The HF Radar System • Data Availability and Quality Control • Validation and first results • Perspectives
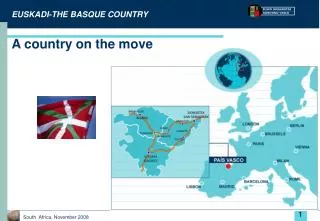
DONOSTIA MATXITAKO Deep water buoy Coastal station HF radar antenna Data available at: http://www.euskalmet.euskadi.net http://www.ibi-roos.eu/ Introduction: the OO System S. SEBASTIAN DONOSTIA BILBAO MATXITXAKO
Matxitxako Donostia Variability of currents over the SLOPE Offshore buoys; over 450 and 550 m depth 2008 WELL-MIXED STRATIFIED
Offshore buoys; over 450 and 550 m depth Variability of currents over the SLOPE 2008 Lomb-Scargle peridogram 120 days, 60days-overlapping segments. Vertically averaged Processes governing the variability U component V component SD SD f f D
10-40 m 100-140 m Offshore buoys; over 450 and 550 m depth Variability of currents over the SLOPE 2008 D2 D2 f f D1 U+V COMPONENTS Lomb-Scargle peridogram 60 days, 30days-overlapping segments. Processes governing the variability at high frequencies, seasons and depth D2 f D1
10-40 m 100-140 m Offshore buoys; over 450 and 550 m depth Variability of currents over the SLOPE 2008 f M2 M2 f VERTICAL SHEAR U+V COMPONENTS Lomb-Scargle power spectra from the vertical gradients of the horizontal velocity components. Contribution to the shear-induced mixing at high frequencies, seasons and depth
Introduction: the HF RADAR System Two radial site stations: Higer and MatxitxakoCentral combine site in Vitoria WORKING SINCE 2009 Matxitxako Antenna (transmitter and receiver) and electronics. MAIN CARACTERISTICS of the BASQUE SYSTEM Radar Frequency (MHz) Typical Resolution3 (km) Typical Bandwidth (kHz) Radar Wavelength (m) Ocean Wavelength (m) Depth of Current1 (m) Typical Range2 (km) Upper H1/3 Limit4 (m) 4.86 30 60 2-3 ~150 ~ 5 25 30
Introduction: the HF RADAR System • FROM CROSS SPECTRA TO RADIAL VELOCITIES • MUSIC (MUltiple SIgnal Classification) Algorithm • [Schmidt, R.O., (1986), IEEE Trans. Antennas Propagat., vol. AP-34, pp. 276-280] • Linear solutions based on eigen-analysis of averaged spectral covariances • Capable of more than two solutions with little added numerical burden • Chooses number of bearings based on both eigenvalue & amplitude ratios • Capable of incorporating measured, distorted antenna patterns • OUTPUT: Vectors in polar coordinate system centered at receive antenna: • 1 radial map per averaged cross spectra file • Typically, seven radial maps “merged” into one hourly map (3-hours running average) • Angular resolutions is 5˚
Introduction: the HF RADAR System • FROM RADIAL TO TOTAL RADIAL VELOCITIES • Several radials from each site contribute to each total vector, being resolved into orthogonal components (U, V) • Linear least squares performed on U, V components separately • From radials with: • An angle of incidence greater than α • α min = 20-30 º • And total velocities < 100-120 cm/s • Defining a • GRID SPACING: 5km • AVERAGING RADIOUS: of 20 KM
Data Availability and Quality Control MEAN COVERAGE AND STD OF TOTAL U, V COMPONENTS Large STD values DATA AVAILABILITY IN 2009
Data Availability and Quality Control • α min = 15º α min = 30º • radial velocities < 150 cm/s radial velocities < 100 cm/s
Data Availability and Quality Control Comparison with Slope buoys
SD SD f f f f f D D D D Data Availability and Quality Control Comparison with Slope buoys ADCP DATA RADAR DATA SD SD SD
Data Availability and Quality Control Comparison with Slope buoys M2 ELLIPES -HARMONIC ANALYSIS - SVD (Press et al., 1989)
Data Availability and Quality Control Comparison with a drifter COURTESY OF GILLES REVERDIN (LOCEAN)
Data Availability and Quality Control QUALITATIVE Comparison with ADCP data COURTESY OF MARIA SANTOS (AZTI)
Data Availability and Quality Control QUALITATIVE Comparison with ADCP data COURTESY OF MARIA SANTOS (AZTI)
Data Availability and Quality Control Comparison withSST IMAGES and WIND forcing….
Data Availability and Quality Control Comparison with SST IMAGES and WIND forcing….
Perspectives- Future work • Use radial velocities for the comparison • Validation of general patterns observed through the comparison with other in-situ data (drifting buoys) and satellite images • Describe surface circulation: • General patterns, seasonal and mesoscale variability (river plumes, eddies) • Harmonic analysis of the data (in progress) to compare with in-situ data and existing models. Mapping current variability associated to f • Reconstruct velocity series (e.g. DINEOF on radial components) to obtain a complete data set : use Lagrangian model to describe surface transport
Perspectives- Future work IMPROVING THE SYSTEM WITH A THIRD ANTENNA IN COMTIS…
Perspectives- Future work • Abstract sent to EOF2010: ‘ COASTAL HF RADAR FOR OPERATIONAL SURFACE CURRENT MONITORING AND MODEL VALIDATION IN THE SE BAY OF BISCAY’. Mader J1.; Rubio, A1.; Fernández, V. 2; González, M1.; Tarafa, N 2.; Fontán, A1.; Ferrer, L1. 1 AZTI-Tecnalia, Pasaia, Spain; 2 Qualitas Remos, Madrid, Spain • FCT GRANT – PHD Student for 2011 ¿? • Planning a workshop in OCTOBER at AZTI… Thanks for your attention !
ADCP data – BIOMAN 6-23 May 2008 4 – 25 May 2009 ? 3 – 23 May 2010
MOORINGS “ECOSISTEMA” in 2010 A B • 4 x RCM9 • 1 x RCM7 • 2 x acoustic release • 1 ADCP (workhorse ~300MHz ~100m rang) upward looking ~100 m ~350 m ?? B A ?? ?? ??