Download
1 / 63
650 likes | 899 Views
Ecosystem Considerations in Fisheries Management. Linking Ecosystem-Based Management Goals with Ecosystem Research. New Since September. Updated 27 contributions Noted last update on all contributions Website: Will be updated Will be on internet by the end of Nov. Full report and

E N D
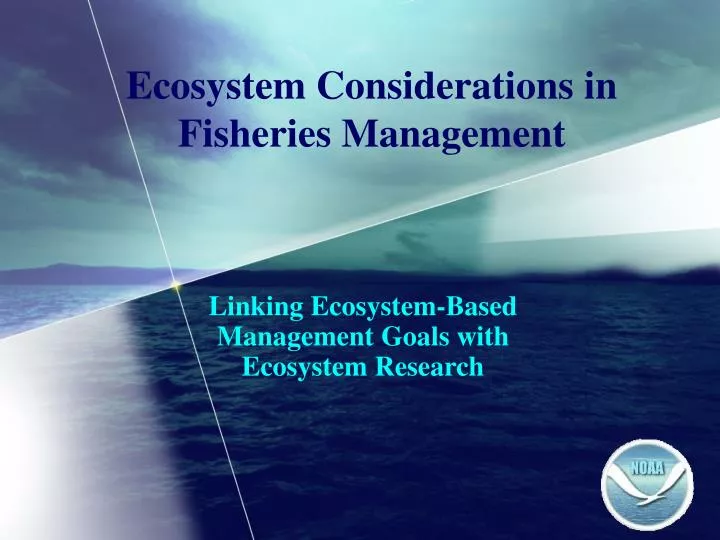
Ecosystem Considerations in Fisheries Management Linking Ecosystem-Based Management Goals with Ecosystem Research
New Since September • Updated 27 contributions • Noted last update on all contributions • Website: • Will be updated • Will be on internet by the end of Nov. • Full report and • Individual contributions • Data http://access.afsc.noaa.gov/REFM/REEM/index.cfm
Organization • Ecosystem Assessment • Ecosystem Status Indicators • Ecosystem-Based Mngt Indices http://access.afsc.noaa.gov/REFM/REEM/index.cfm
OCEAN -GOA Bottom Temperatures(Martin) 1 1 Depth 51-100 Depth 101-150 0.5 0.5 Depth <50 1 0 0 -0.5 -0.5 -1 -1 0 1 1 1 Depth 151-200 Depth 201-300 Depth 301-400 Mean Residual 0.5 0.5 0.5 0 0 0 -1 -0.5 -0.5 -0.5 -1 -1 -1 1 1 1 Depth 401-500 Depth 501-700 Depth 701-1000 -2 0.5 0.5 0.5 1999 2001 2003 1984 1987 1990 1993 1996 2005 0 0 0 -0.5 -0.5 -0.5 -1 -1 -1
HABITAT- Effects of fishing on seafloor habitat(Heifetz et al.)
FORAGE- Eulachon(Martin, Lauth) • GOA • Western Central Eastern 800 800 800 400 400 400 0 0 0 1984 1989 1994 1999 2004 1984 1989 1994 1999 2004 1984 1989 1994 1999 2004 CPUE (kg/km2) EBS 30 20 10 0 1982 1984 1986 1988 1990 1992 1994 1996 1998 2000 2002 2004 2006
GROUNDFISH-EBS Winter spawning flatfish (Ingraham and Wilderbuer )
BENTHIC- ADFG GOA Large-mesh survey (Urban)
MISCELLANEOUS Jellyfish(Martin, Lauth) 400,000 300,000 Biomass (t) 200,000 100,000 0 2006 2004 1982 1984 1986 1988 1990 1992 1994 1996 1998 2000 2002 • GOA • Western Central Eastern 500 500 500 400 400 400 CPUE (kg/km2) 300 300 300 200 200 200 100 100 100 0 0 0 1984 1989 1994 1999 2004 2004 1984 1989 1994 1999 1984 1989 1994 1999 2004 EBS
MISCELLANEOUS -Grenadiers(Clausen and Gaichas) 100-200 2005 Gulf of Alaska Trawl Survey Highest catch weight for GOA non-target species Potentially sensitive life history (live 50-75 yrs) Small exploratory giant grenadier fishery effort in 2005 Potential fishery value for less common, deeper sp. Important component of deep sea ecosystem (?) 200-300 300-500 500-700 700-1000 0 50 100 150 200 250 Depth stratum (m) 200-400 2004 Bering Sea Trawl Survey 400-600 600-800 800-1000 1000-1200 0 50 100 150 200 250 Giant Pacific Biomass (1,000's of metric tons) Popeye
15 15 2003 1997 10 10 mean=32.4 mean=31.7 5 5 0 0 10 20 30 40 50 10 20 30 40 50 15 15 1999 2005 10 10 mean=31.0 mean=30.6 5 5 0 0 10 20 30 40 50 10 20 30 40 50 15 2001 10 mean=33.1 5 0 10 20 30 40 50 Percent EBS Grenadier population size composition (longline surveys) Pre-anal Fin Length (cm)
300000 250000 200000 AI GOA 150000 BS Observed Hook and Line duration (hours) 100000 50000 0 1990 1992 1994 1996 1998 2000 2002 2004 Ecosystem Mngt Info. –Hook and Line effort(Coon)
Ecosystem Mngt Info. –Bottom trawl effort(Coon) 3500 3000 2500 2000 Observed Bottom Trawl duration (24 hour days) 1500 BS GOA 1000 AI 500 0 2004 1990 1992 1994 1996 1998 2000 2002
Executive Summary • CLIMATE • North Pacific in uncertain state • BS continues to warm, less sea ice and earlier retreat • GOA bottom temps in shallow areas continue to increase • BIOLOGY • BS summer zooplankton biomass: low 2000-2004 • BS jellyfish biomass: low 2000-2004 • Warming trend may affect flatfish distribution • Climate change may affect GOA community • Most seabirds show no discernable population trend • 2002 seabird breeding chronology was early • 2004 N. fur seal pups born continued to decline • 2004 non-pup Steller sea lion counts increased in most areas • ASP in BS and GOA decreased from 1978-2004 • FISHERY EFFECTS • 2003 and 2004 increases in herring and other salmon bycatch • 2003 seabird bycatch rate increased
October Council Meetings • Presented to SSC, AP, and Council • SSC Comments: • Commend all contributors • Label when contributions were updated • Further development of executive summary • Link stock assessment results with updates to the ecosystem assessment and • Incorporate climate information into stock assessments and the ecosystem assessment.
Next Year • One full update; one partial update • Update website http://access.afsc.noaa.gov/REFM/REEM/index.cfm
Website: Geoff Lang http://intra.afsc.noaa.gov/reem/index.cfm
Website Updates • Data and contributions last updated in spring • Next update: late fall, after final draft • Internet in fall http://intra.afsc.noaa.gov/reem/index.cfm
Organization • Ecosystem Assessment • Ecosystem Status Indicators • Ecosystem-Based Mngt Indices
CLIMATE and FISHING Objectives for Ecosystem Protection: • Maintain predator-prey relationships • pelagic forage availability • spatial/temporal conc. of fishery impact on forage fish • removals of top predators • introduction of non-native species • Maintain diversity • species diversity • functional (trophic, structural habitat) diversity • genetic diversity • Maintain energy flow and balance • human-induced energy redirection • system impacts attributable to energy removal
1900 1910 1920 1930 1940 1950 1960 1970 1980 1990 2000 3 a ) P D O , w i n t e r ( D J F ) 2 2 2 0 0 3 b ) P D O , w i n t e r ( D J F ) 1 9 7 7 1 9 7 7 1 1 9 5 8 1 0 -1 0 1 9 8 9 3 -2 1 9 8 9 1 9 6 2 -1 2 -3 1 9 4 6 c ) A O , w i n t e r ( D J F ) 1 9 7 2 1 -2 0 -3 1 9 9 4 -1 -2 4 e ) V i c z 5 0 0 , w i n t e r ( N o v - M a r ) 1 9 9 8 2 0 -2 2 0 0 3 3 1 9 7 7 -4 f ) E C N P ( J a n - F e b ) 2 2 0 0 0 1 9 6 0 1 0 -1 1 9 6 8 -2 1950 1960 1970 1980 1990 2000 CLIMATE(Rodionov et al.)
SLP (Rodionov et al.) 1972-76 SLP SST 1977-81 SLP SST
CLIMATE 500 hPa height-anomaly(Rodionov et al.) 1989-97 1998-04
OCEAN -Bering Sea Ice (Rodionov et al.) 2 a ) I c e c o v e r i n d e x 1 d 0 t S -1 D -2 80 a y s 60 a f t 40 e b ) I c e r e t r e a t i n d e x r M 20 a r 0 c h 1 5 1955 1960 1965 1970 1975 1980 1985 1990 1995 2000 2005
BIOLOGY-Bering Sea Jellyfish (Walters) 400,000 350,000 300,000 250,000 Biomass (t) 200,000 150,000 100,000 50,000 0 2002 2004 1986 1988 1990 1992 1994 1996 1980 1982 1984 1998 2000
4 Arrowtooth flounder 3 2 1 0 -1 -2 1985 1990 1995 2000 4 Pacific halibut 3 4 Northern lampfish 2 3 1 2 0 1 -1 0 -2 -1 1985 1990 1995 2000 -2 4 1985 1990 1995 2000 Southern rocksole 3 2 1 0 -1 -2 1985 1990 1995 2000 4 Northern rocksole 3 2 1 0 -1 -2 1985 1990 1995 2000 Biological Response to Climate –Ichthyoplankton(Doyle et al.)
Biological Response to Climate- GOA Small Mesh Survey (Litzow) Jellyfish ATF Pollock FHS 0.7 0.5 5 0.5 0.4 4 0.3 3 0.3 0.2 2 0.1 0.1 1 Community state (A1 score) Local climate state (PC1 score) 0 0 -0.1 -0.1 -1 -0.2 -2 -0.3 -0.3 -3 Sculpins Red K.crab P. sandfish Sidestr. shrimp Humpy shrimp Coonstr. shrimp Capelin N. pink shrimp -0.5 -0.4 -4 -0.5 -5 -0.7 1972 1976 1980 1984 1988 1992 1996 2000 2004 Community axis 1 (Pavlof, Chignik-Castle, Kuiukta) Community axis 1 (all bays) Local climate PC 1 Spearman r
Biological Response to Climate B.Sea 0.40 0.20 YFS ATF 0.30 POLLOCK 0.10 0.20 0.20 0.10 0.00 0.00 -0.10 0.00 -0.10 -0.20 -0.20 -0.20 0.20 2002 2002 1996 1996 ROCK SOLE 1984 1984 1960 1960 1966 1966 1972 1972 1978 1978 1990 1990 0.60 COD 0.40 0.00 0.20 0.00 -0.20 -0.20 -0.40 FH SOLE 0.40 0.40 GT 0.20 0.20 0.00 0.00 -0.20 -0.20 -0.40 1.00 AK PLAICE 1960 1966 1972 1978 1984 1990 1996 2002 0.50 0.40 POP 0.00 0.20 -0.50 0.00 NORTHERNS 0.20 -0.20 0.10 -0.40 0.00 2002 1960 1966 1972 1978 1984 1990 1996 -0.10 0.30 AI ATKA 0.20 0.10 0.00 -0.10 1960 1966 1972 1978 1984 1990 1996 2002 1976/77 shift 1988/89 shift Other shift R/S Anomalies
Biological Response to Climate Flatfish Distribution-(Spencer)