Download

1 / 15
150 likes | 221 Views
Section 4.3. Graphing Exponential Functions. Example. Graph by hand. Solution. List input–output pairs (see table) Input increases by 1 and output multiplies by 2 Plot these points (see next slide). Section 4.3. Slide 2. Graphing Exponential Functions with b > 1.

E N D
Section 4.3 Graphing Exponential Functions
Example Graph by hand. Solution • List input–output pairs (see table) • Input increases by 1 and output multiplies by 2 • Plot these points (see next slide) Section 4.3 Slide 2 Graphing Exponential Functions with b > 1 Graphing Exponential Functions
Solution Continued • Use graphing calculator to verify Section 4.3 Slide 3 Graphing Exponential Functions with b > 1 Graphing Exponential Functions
Example Graph by hand. Solution • List input–output pairs (see table) • For example • (–1, 8) is a solution • x increases by 1, y is multiplied by ½ Section 4.3 Slide 4 Graphing Exponential Functions with 0< b < 1 Graphing Exponential Functions
Solution Continued Section 4.3 Slide 5 Graphing Exponential Functions with 0< b < 1 Graphing Exponential Functions
Property For an exponential function of the form y = abx, if the value of the independent variable increases by 1, the value of the dependent variable is multiplied by b. For the function , as the value of x increases by 1, the value of y is multiplied by 3 For the function , as the value of x increases by 1, the value of y is multiplied by 3/4 Illustration Section 4.3 Slide 6 Base Multiplier Property; Increase or Decreasing Property Base Multiplier Property
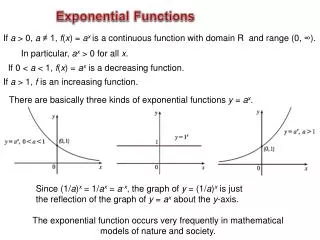
Property Let , where a > 0. Then If b > 1, then the function f is increasing. We say that the function grows exponentially (left). If 0 < b < 1, then the function f is decreasing. We say that the function decays exponentially (right). Section 4.3 Slide 7 Increase or Decrease Property Base Multiplier Property
Property For an exponential function of the form the y-intercept is (0, a). The function , the y-intercept is (0, 5) The function , the y-intercept is (0, 4) Illustration Section 4.3 Slide 8 Y-intercept of an Exponential Function Intercepts
Warning Exponential function of the form , the y-intercept is not (0, b). By writing , we see that the y-intercept is (0, 1). For example, for , the y-intercept is (0, 1). Let 1. Find the y-intercept of f. Example Section 4.3 Slide 9 Intercepts and Graph of an Exponential Function Intercepts
Solution is of the form , We know that the y-intercept is (0, a), or (0, 6). 2. Find the x-intercept of f. By base multiplier property, x increases by 1, y value multiplies by ½ Example Solution Section 4.3 Slide 10 Intercepts and Graph of an Exponential Function Intercepts
Solution Continued No number of halvings will result in zero As x grows large, y gets closer to the x-axis Called horizontal asymptote 3. Graph f by hand. Example Section 4.3 Slide 11 Intercepts and Graph of an Exponential Function Intercepts
Solution Plot solutions from the table • Verify on graphing calculator Section 4.3 Slide 12 Intercepts and Graph of an Exponential Function Intercepts
Example • The graph of an exponential function f is shown. • Find f(2). • Blue arrow shows input of x = 2 leads to an output y = 8 • f(2) = 8 Solution Section 4.3 Slide 13 Finding Values of a Function from Its Graph Reflection Property
Example • 2. Find x when f(x) = 2. • Red arrow shows output of y = –2 leads to an input x = 2 • x = –2 when f(x) = 2 Solution Section 4.3 Slide 14 Finding Values of a Function from Its Graph Reflection Property
Example • 3. Find x when f(x) = 0. • Graphs of exponential functions get close to zero, but never reaches x-axis • No value of x where f(x) = 0 Solution Section 4.3 Slide 15 Finding Values of a Function from Its Graph Reflection Property