Download
1 / 19
190 likes | 304 Views
Chart Components. 4.02 Understand charts and graphs used in business. Why do you need to learn about charts? . Why might you use a chart to present spreadsheet information? What does a chart do that a spreadsheet does not?. Data Series. Is it a chart or a graph?.

E N D
Chart Components 4.02 Understand charts and graphs used in business.
Why do you need to learn about charts? • Why might you use a chart to present spreadsheet information? • What does a chart do that a spreadsheet does not? 4.02 Understand charts and graphs used in business
Data Series Is it a chart or a graph? • A graph is a feature of a chart used to plot data. (includes plot area, gridlines & values) • The chart is the total package that includes the title, labels, legend, color & adds meaning to the graph. 4.02 Understand charts and graphs used in business
Examples of business uses of charts • To represent sales trends within the different departments of a store. • To represent the contribution of individual employee sales to the total sales for a company. • To represent the percent of each expense to total expenses. • To explain stock price fluctuations to stockholders. 4.02 Understand charts and graphs used in business
Data Marker Y-Axis X-Axis Components of Graphs and Charts • Y- axis - the left vertical side; it contains the numerical data. • X-axis - the bottom horizontal side; it contains the category information. • Data markers -represent data values. 4.02 Understand charts and graphs used in business
Data Series Data Series • A collection of related values from the worksheet; one row/column on the spreadsheet. 4.02 Understand charts and graphs used in business
Gridline Gridline • Horizontal or vertical line that extends across the plot area of the graph to make it easier to read and understand the values. 4.02 Understand charts and graphs used in business
Plot Area Plot Area • The rectangular area bound by the category (x) and values (y) axes. • The background portion of the graph. 4.02 Understand charts and graphs used in business
Tick Marks Tick Mark • Used to add clarification to the data categories or values. 4.02 Understand charts and graphs used in business
Legend Legend • The object that explains the symbols, colors, or patterns used to differentiate the data. 4.02 Understand charts and graphs used in business
Data Labels Data Label • Single value or piece of data from the data series. 4.02 Understand charts and graphs used in business
Title Chart Title • The main heading that describes the purpose and content. 4.02 Understand charts and graphs used in business
Axis Titles Axis Titles • Describe the x and y axis data. • The x axis describes the horizontal data. • The y axis describes the vertical data. 4.02 Understand charts and graphs used in business
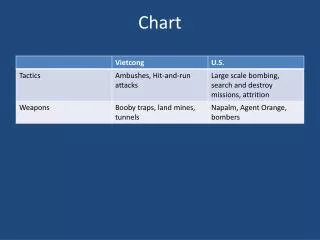
2. 1. 5. 3. 4. 7. 6. 10. 9. 8. Now it’s your turn! See if you can identify all of the components and describe their functions. 4.02 Understand charts and graphs used in business
2. 1. 5. 3. 4. 7. 6. 10. 9. 8. How’d you do? 1. Data Series 2. Chart Title 3. Y Axis Labels 4. Data Labels 5. Plot Area 6. Gridline 7. Legend 8. X Axis Labels 9. X Axis Title 10. Tick Mark 4.02 Understand charts and graphs used in business
Embedded vs. Separate • An embedded chart is one that appears on the same sheet as the worksheet it represents. • A separate chart is one that does not appear on the same sheet as the worksheet it represents. 4.02 Understand charts and graphs used in business
Linked Chart • A linked chart is one that will change to reflect changes made to the spreadsheet it represents. 4.02 Understand charts and graphs used in business
The End 4.02 Understand charts and graphs used in business